Air Quality, Light, and Noise Pollution Monitoring with RaspberryPi Pico, PicoEnviro+, and PMS5003
By Dr Jennifer Martay PE, Course Leader for Medical Engineering at Anglia Ruskin University
I am a Biomedical Engineer, interested in all things engineering and building up my electronics skills. I have
worked with Arduino many times before, but this is my first
experience into RaspberryPi - or more specifically the RaspberryPi Pico. I was inspired to do this project by the
Chelmsford Science and Engineering Society's
"Fresh Air - Fresh Thinking" project.
What did I think about this project?
This is a great project that anyone can do!
If you are an experienced RaspberryPi user, this will be a plug-and-play experience for
you. You will probably be collecting data within an hour. If you are new to RaspberryPi (more specifically the Pico), you will
need to install some software first and learn a bit about how to interact with the Pico. The RaspberryPi Pico, PicoEnviro+, and
PMS5003 equipment are easy to get up and running - even for a newbie Pi/Pico user. I was collecting data on the first day of
the project - and within a week had loads of interesting data about ways to improve the noise levels and air and light quality of
my home.
While I could find many helpful websites about using the Enviro+ with a RaspberryPi, I could not find a website focusing on
the details of the PicoEnviro+ and RaspberryPi Pico. Hopefully this website helps others doing this project!
For more details, watch the video below and/or keep reading!
Step 1: Buy and Prepare the Components
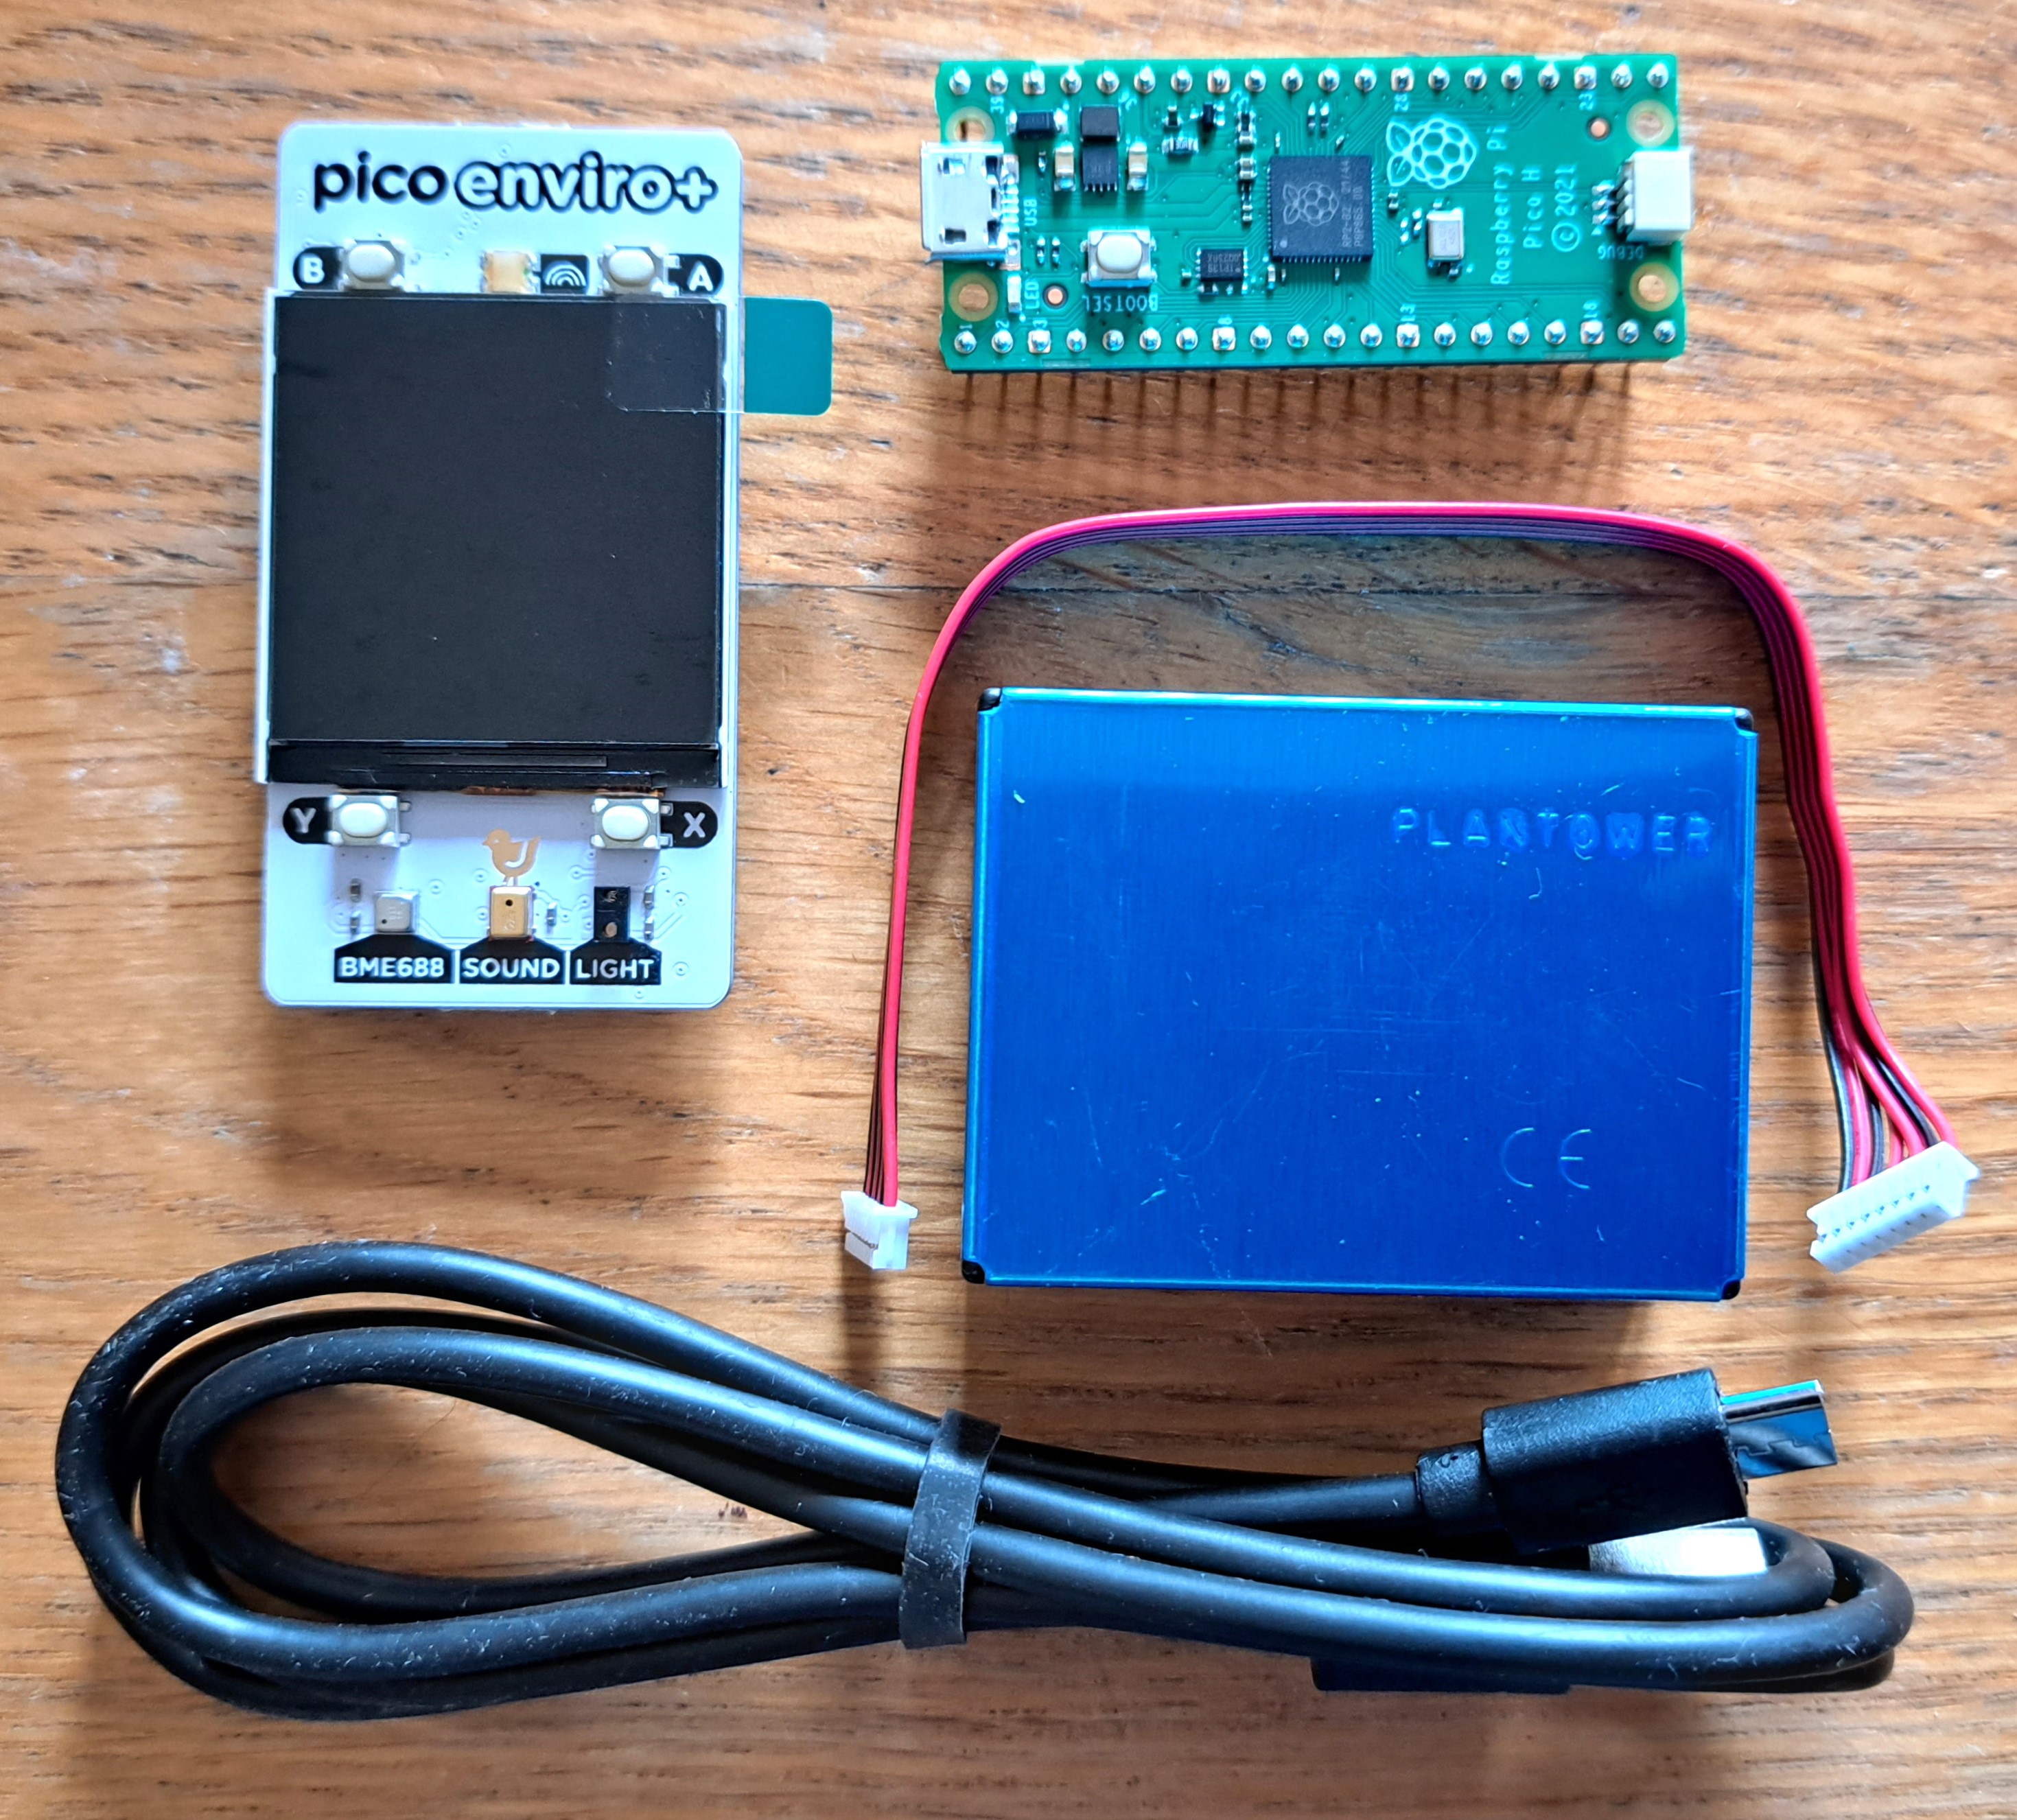
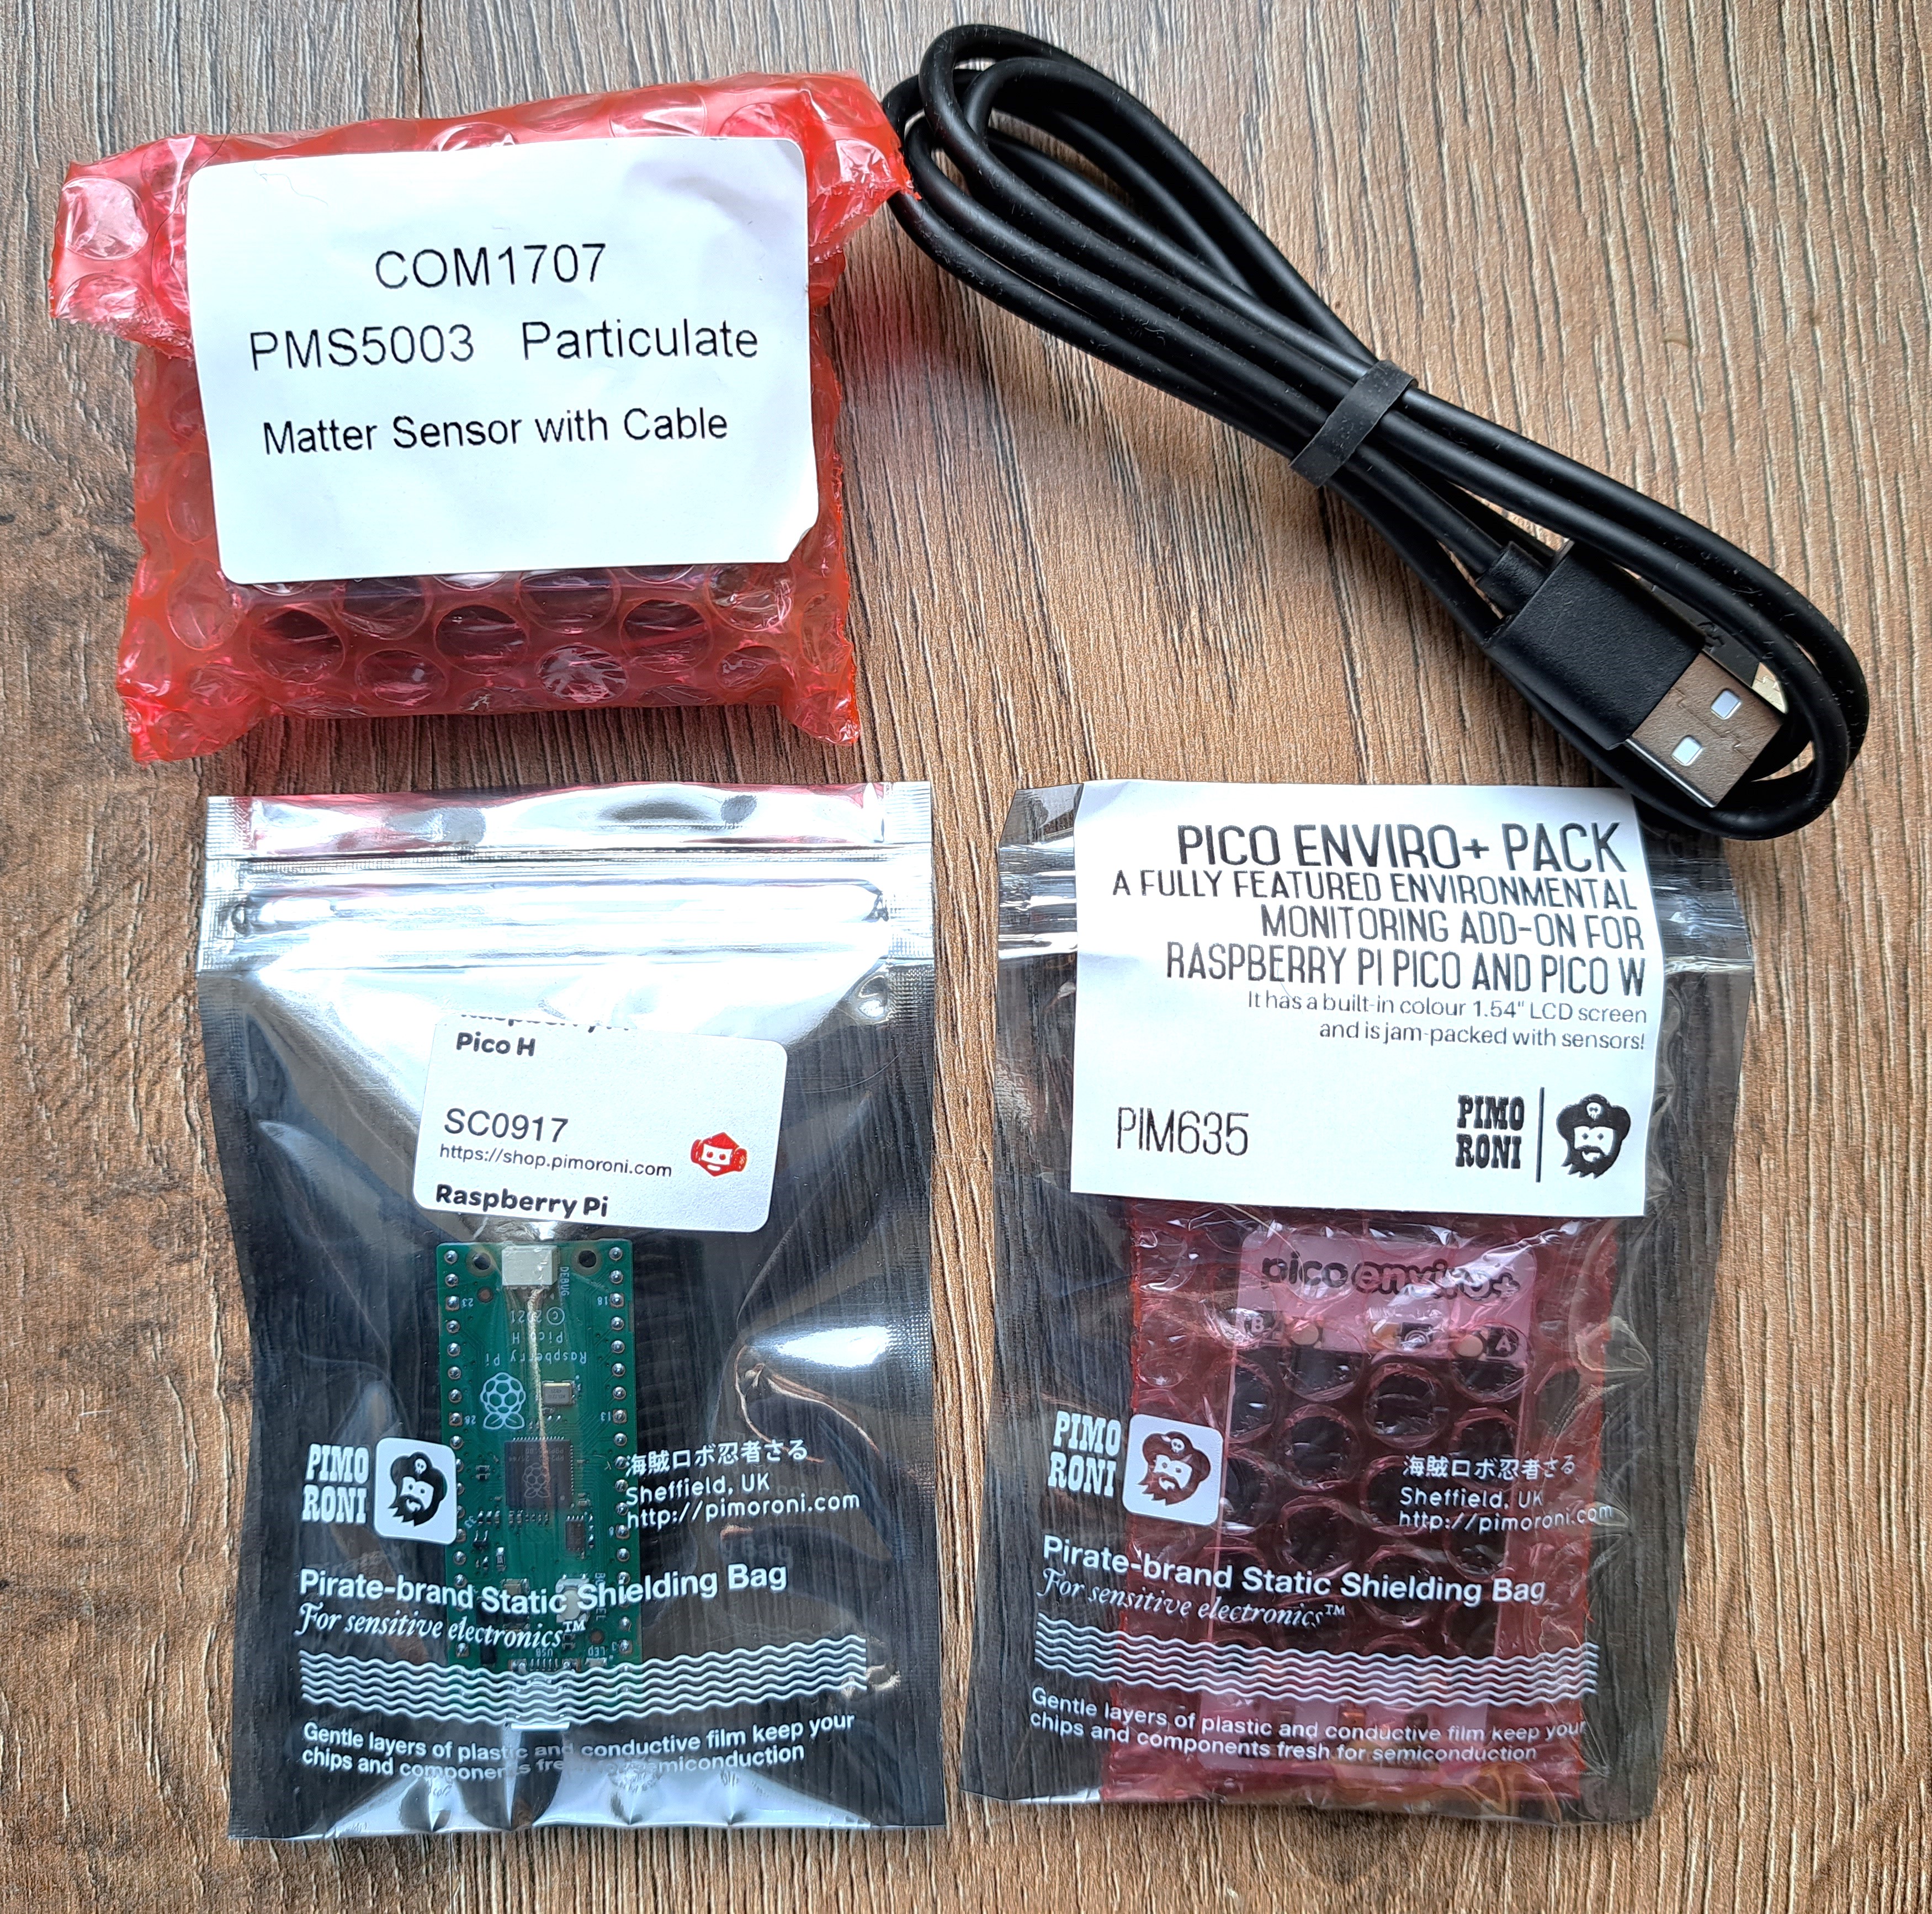
This project uses the following (all bought from Pimoroni in Nov 2022):-RaspberryPi Pico H (came with pre-soldered header pins): £4.50
-PicoEnviro+ Pack: £27.00
-PMS5003 Particulate Matter Sensor from Plantower (came with cable): £17.40
-USB A to Micro-B Cable: £1.62
I used Pimoroni's "Getting Started with Raspberry Pi Pico" to get going. The website first compares a RaspberryPi and a Pico. Then the website explains how to download/install the custom firmware Micropython (download "pimoroni-enviro-v1.20.4-micropython.uf2" for this project - not the suggested pico uf2), load the uf2 onto the Pico (press the Pico's BOOTSEL button while connecting the Pico to your computer), download/install Thonny (what you use to talk with the Pico), and solder the header pins if your Pico didn't already have them attached.
Step 2: Assemble the Sensors
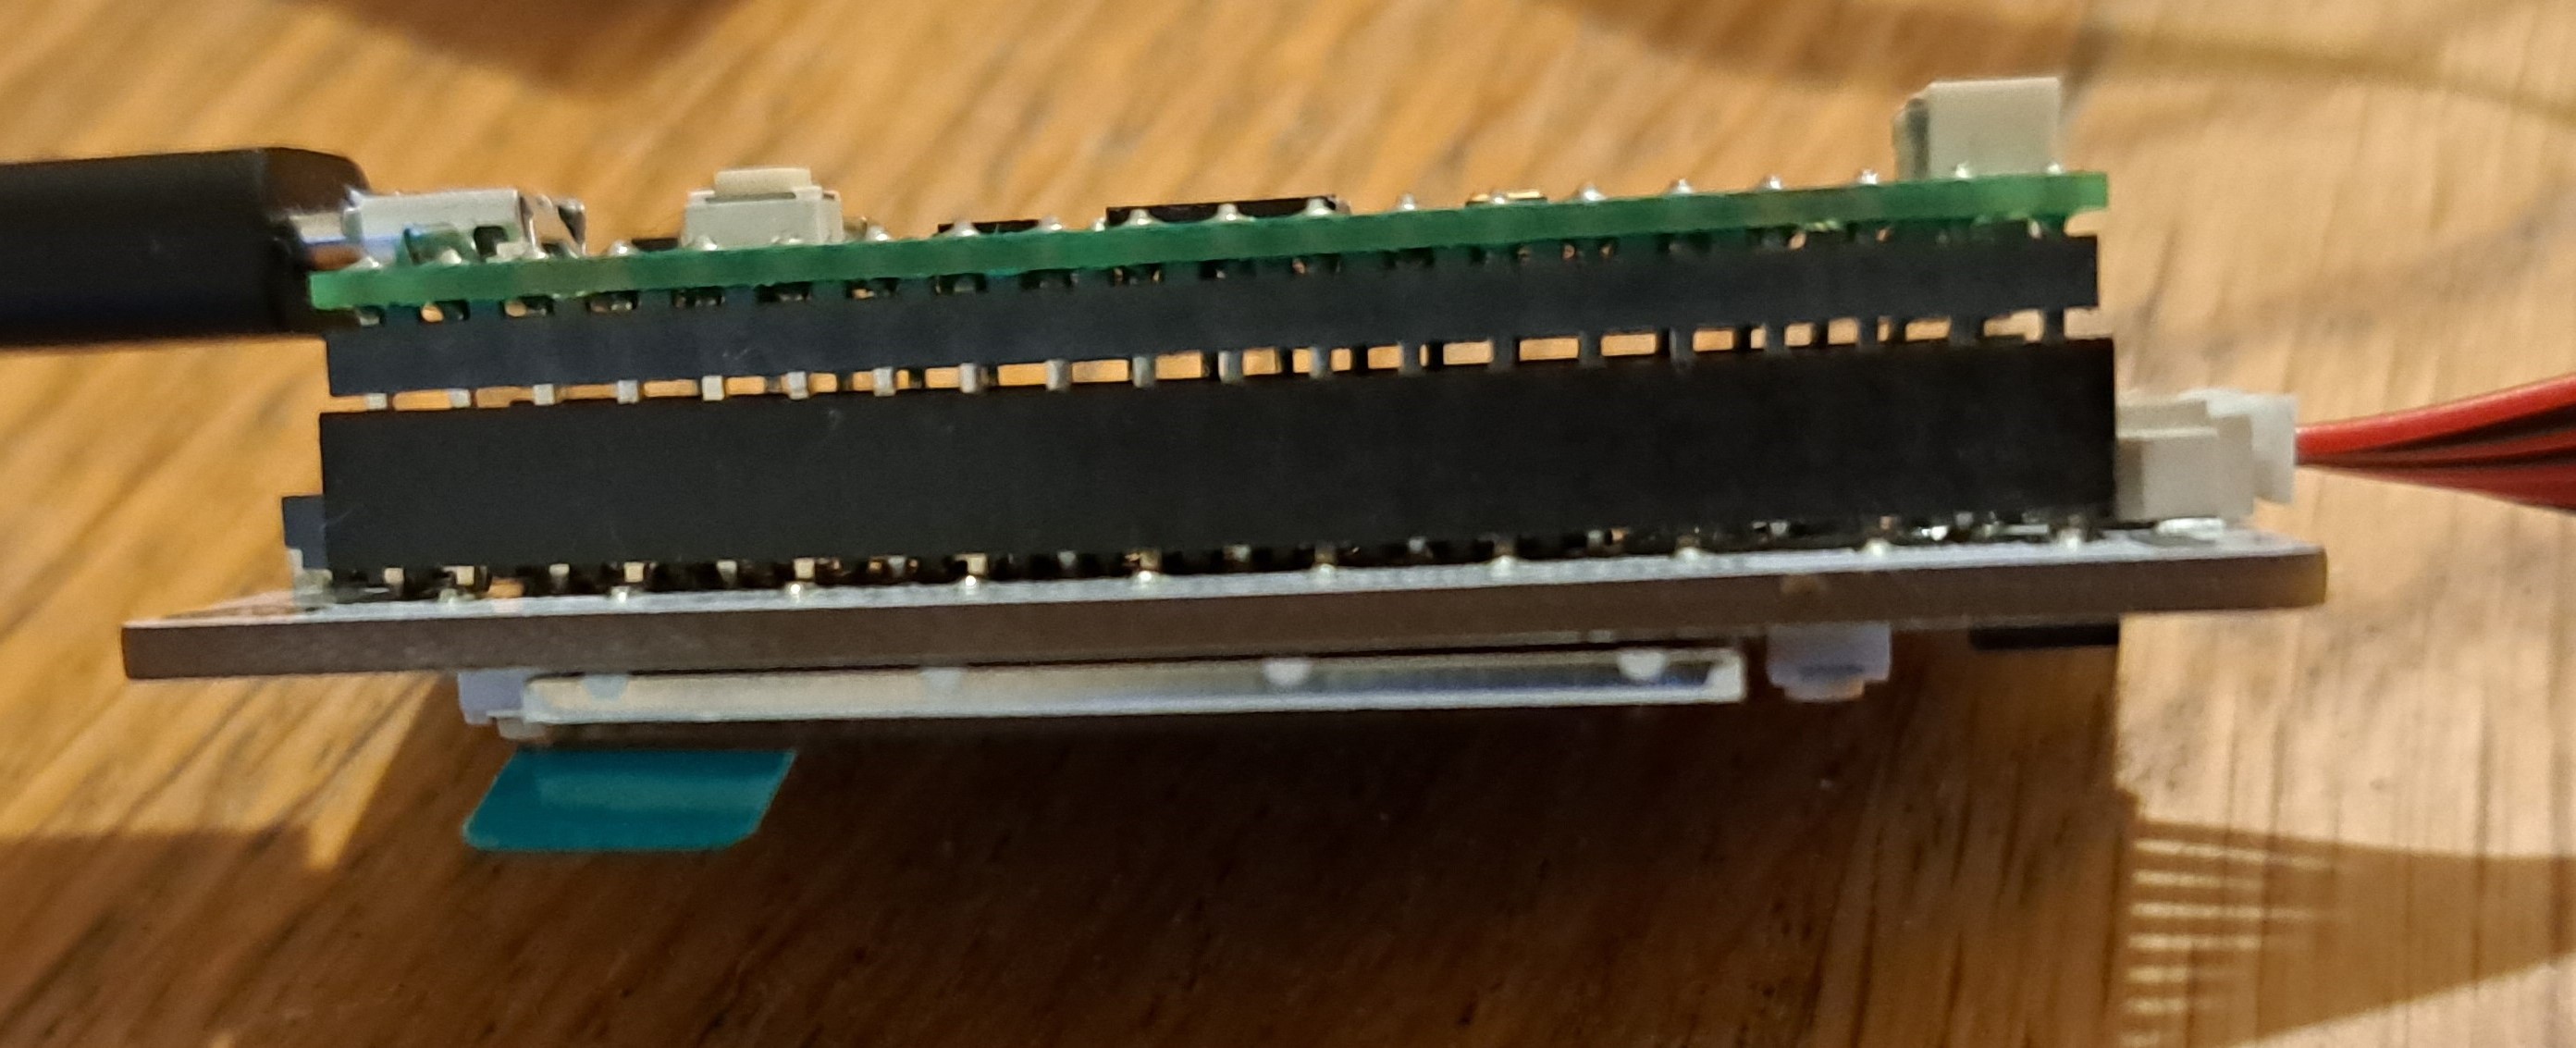
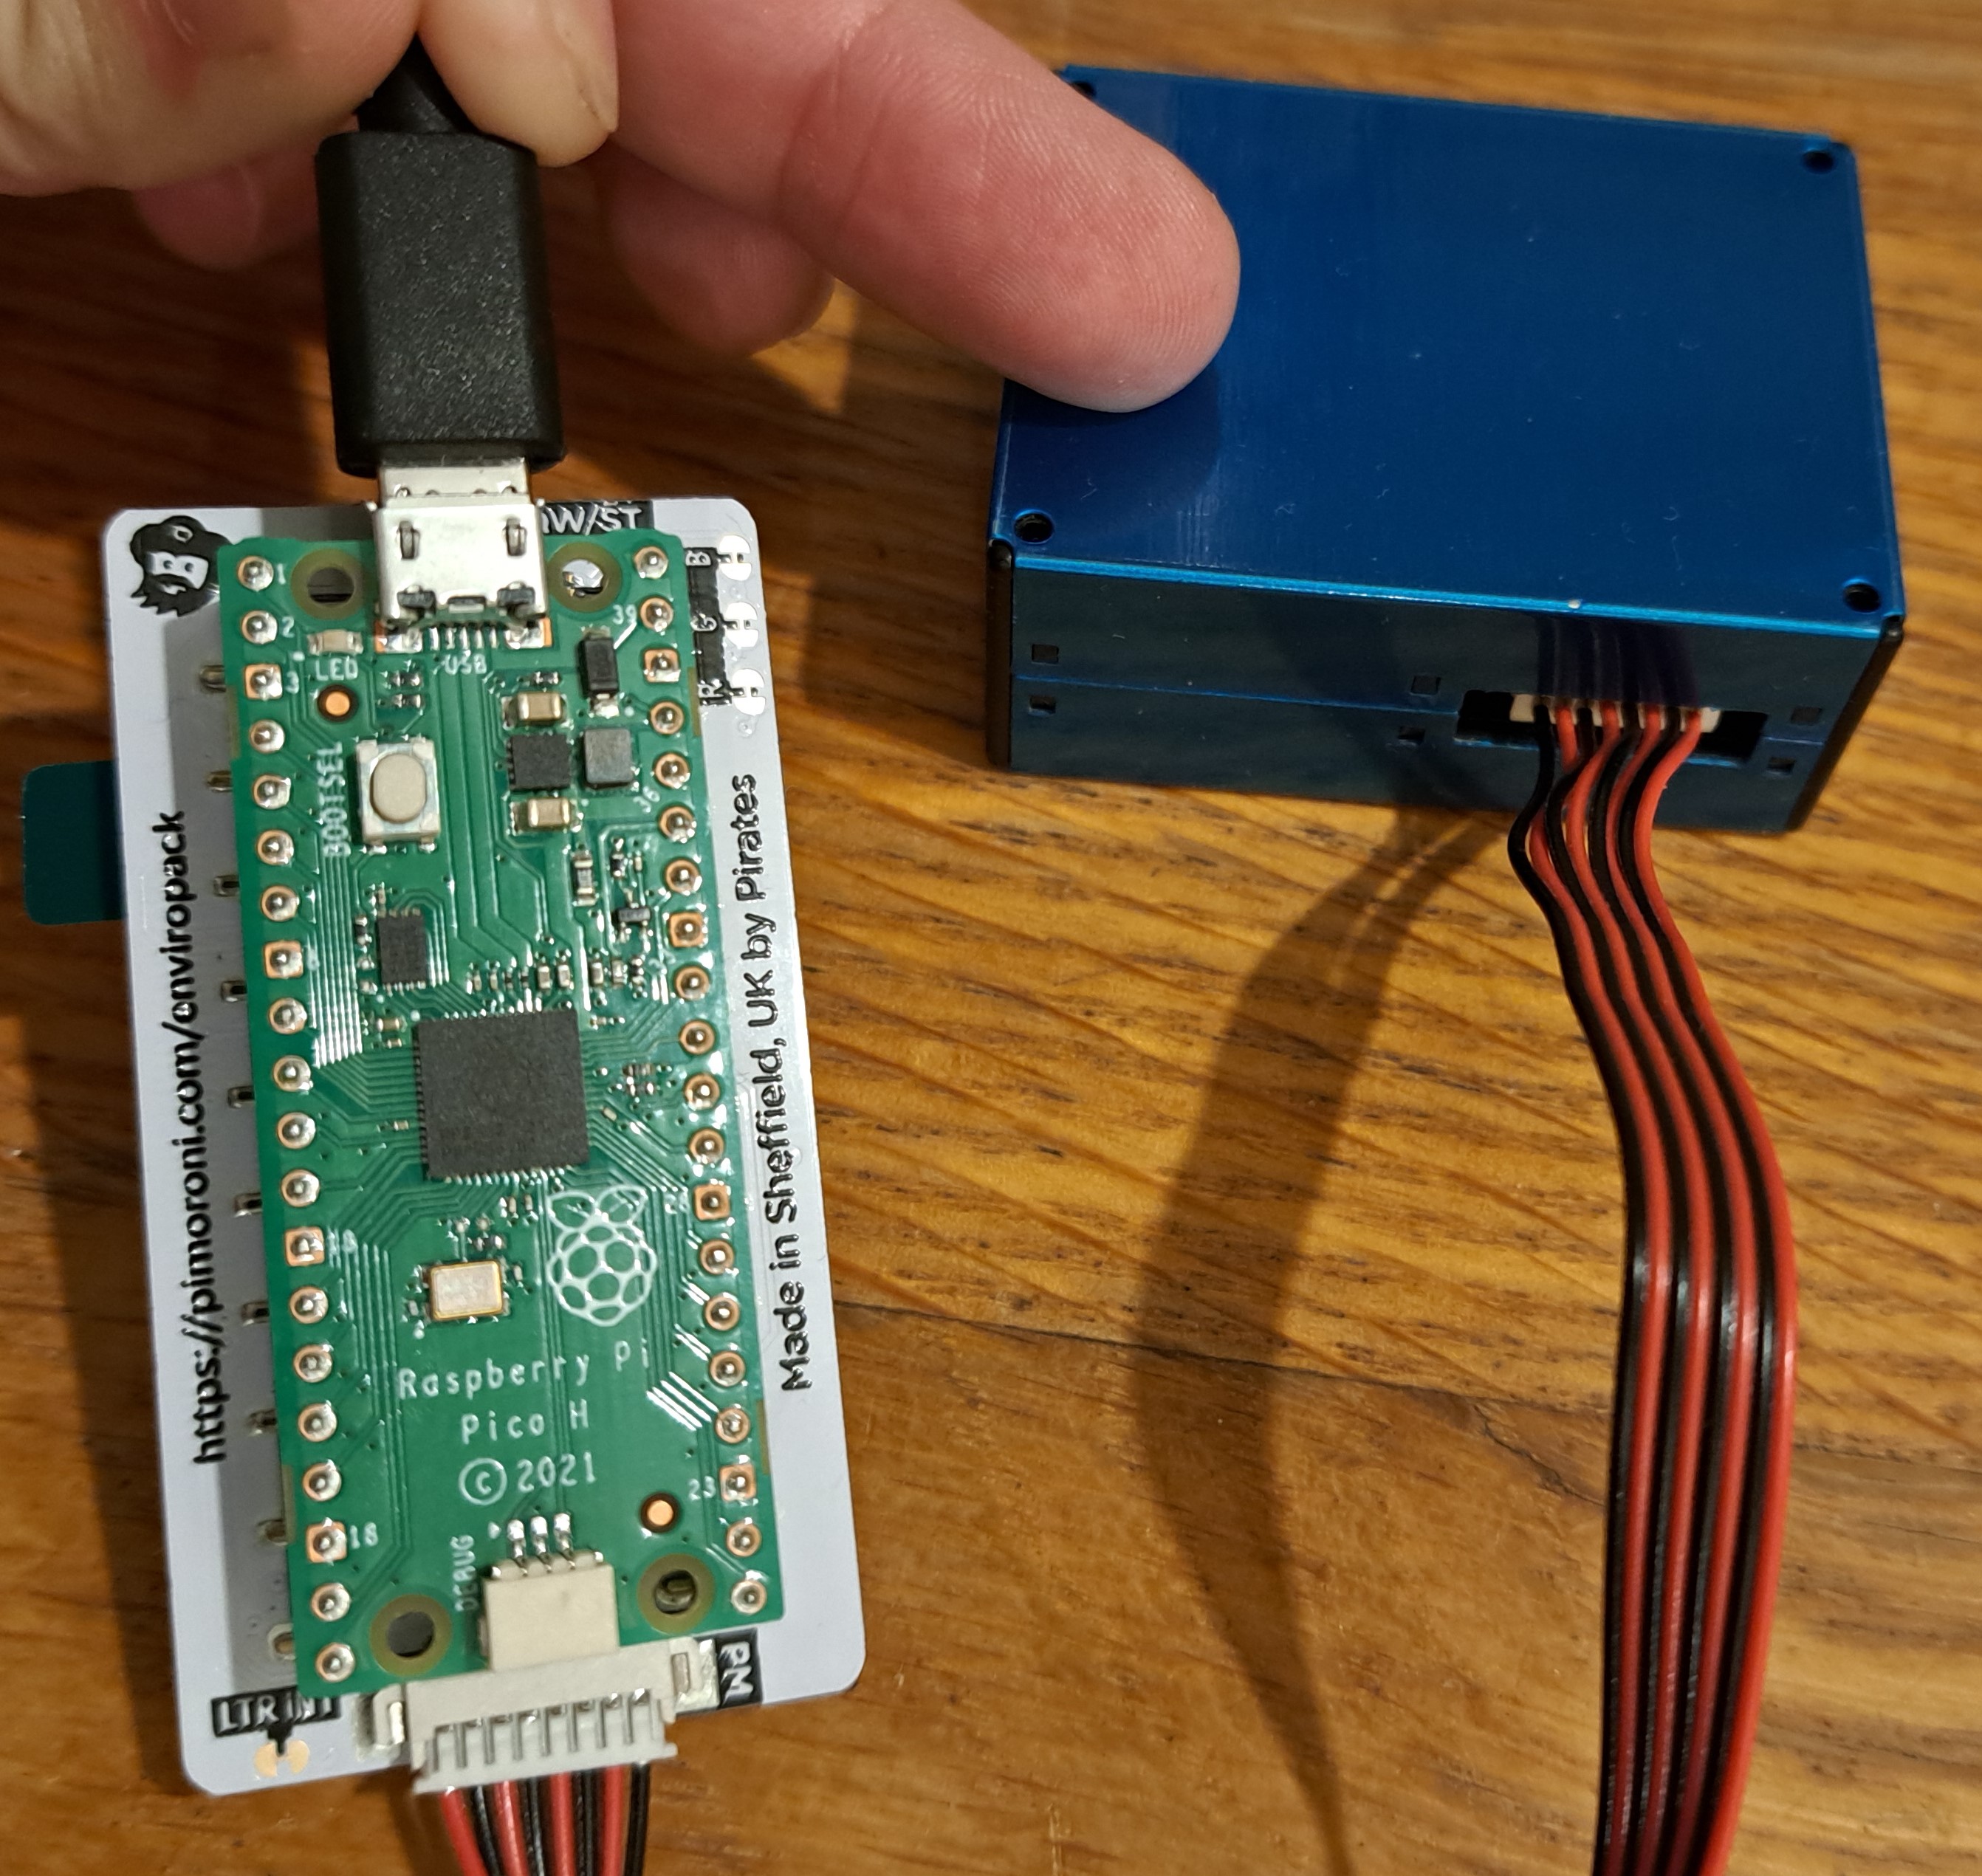
First, connect the computer to the RaspberryPi Pico using the USB cable. The USB A cable would not go directly into my computer's USB C port so I had to use an adaptor. My Pico would not connect if I plugged the USB cable into a 6-in-1 adaptor going into the computer. I needed to use a 1-to-1 adaptor instead.Next, insert the pins on the back of the Pico into the PicoEnviro+ Pack. Make sure that the pins are pushed all the way in. Originally, I had not pushed the pins in enough (see first/left figure below), and the PMS5003 sensor would not return data. The pins should be pushed in as shown in the second/right figure below. The words on the Pico and PicoEnviro+ should both be the right way up (ie, you can read them both properly as opposed to one set of words being upside down). I have shown the required orientation below.
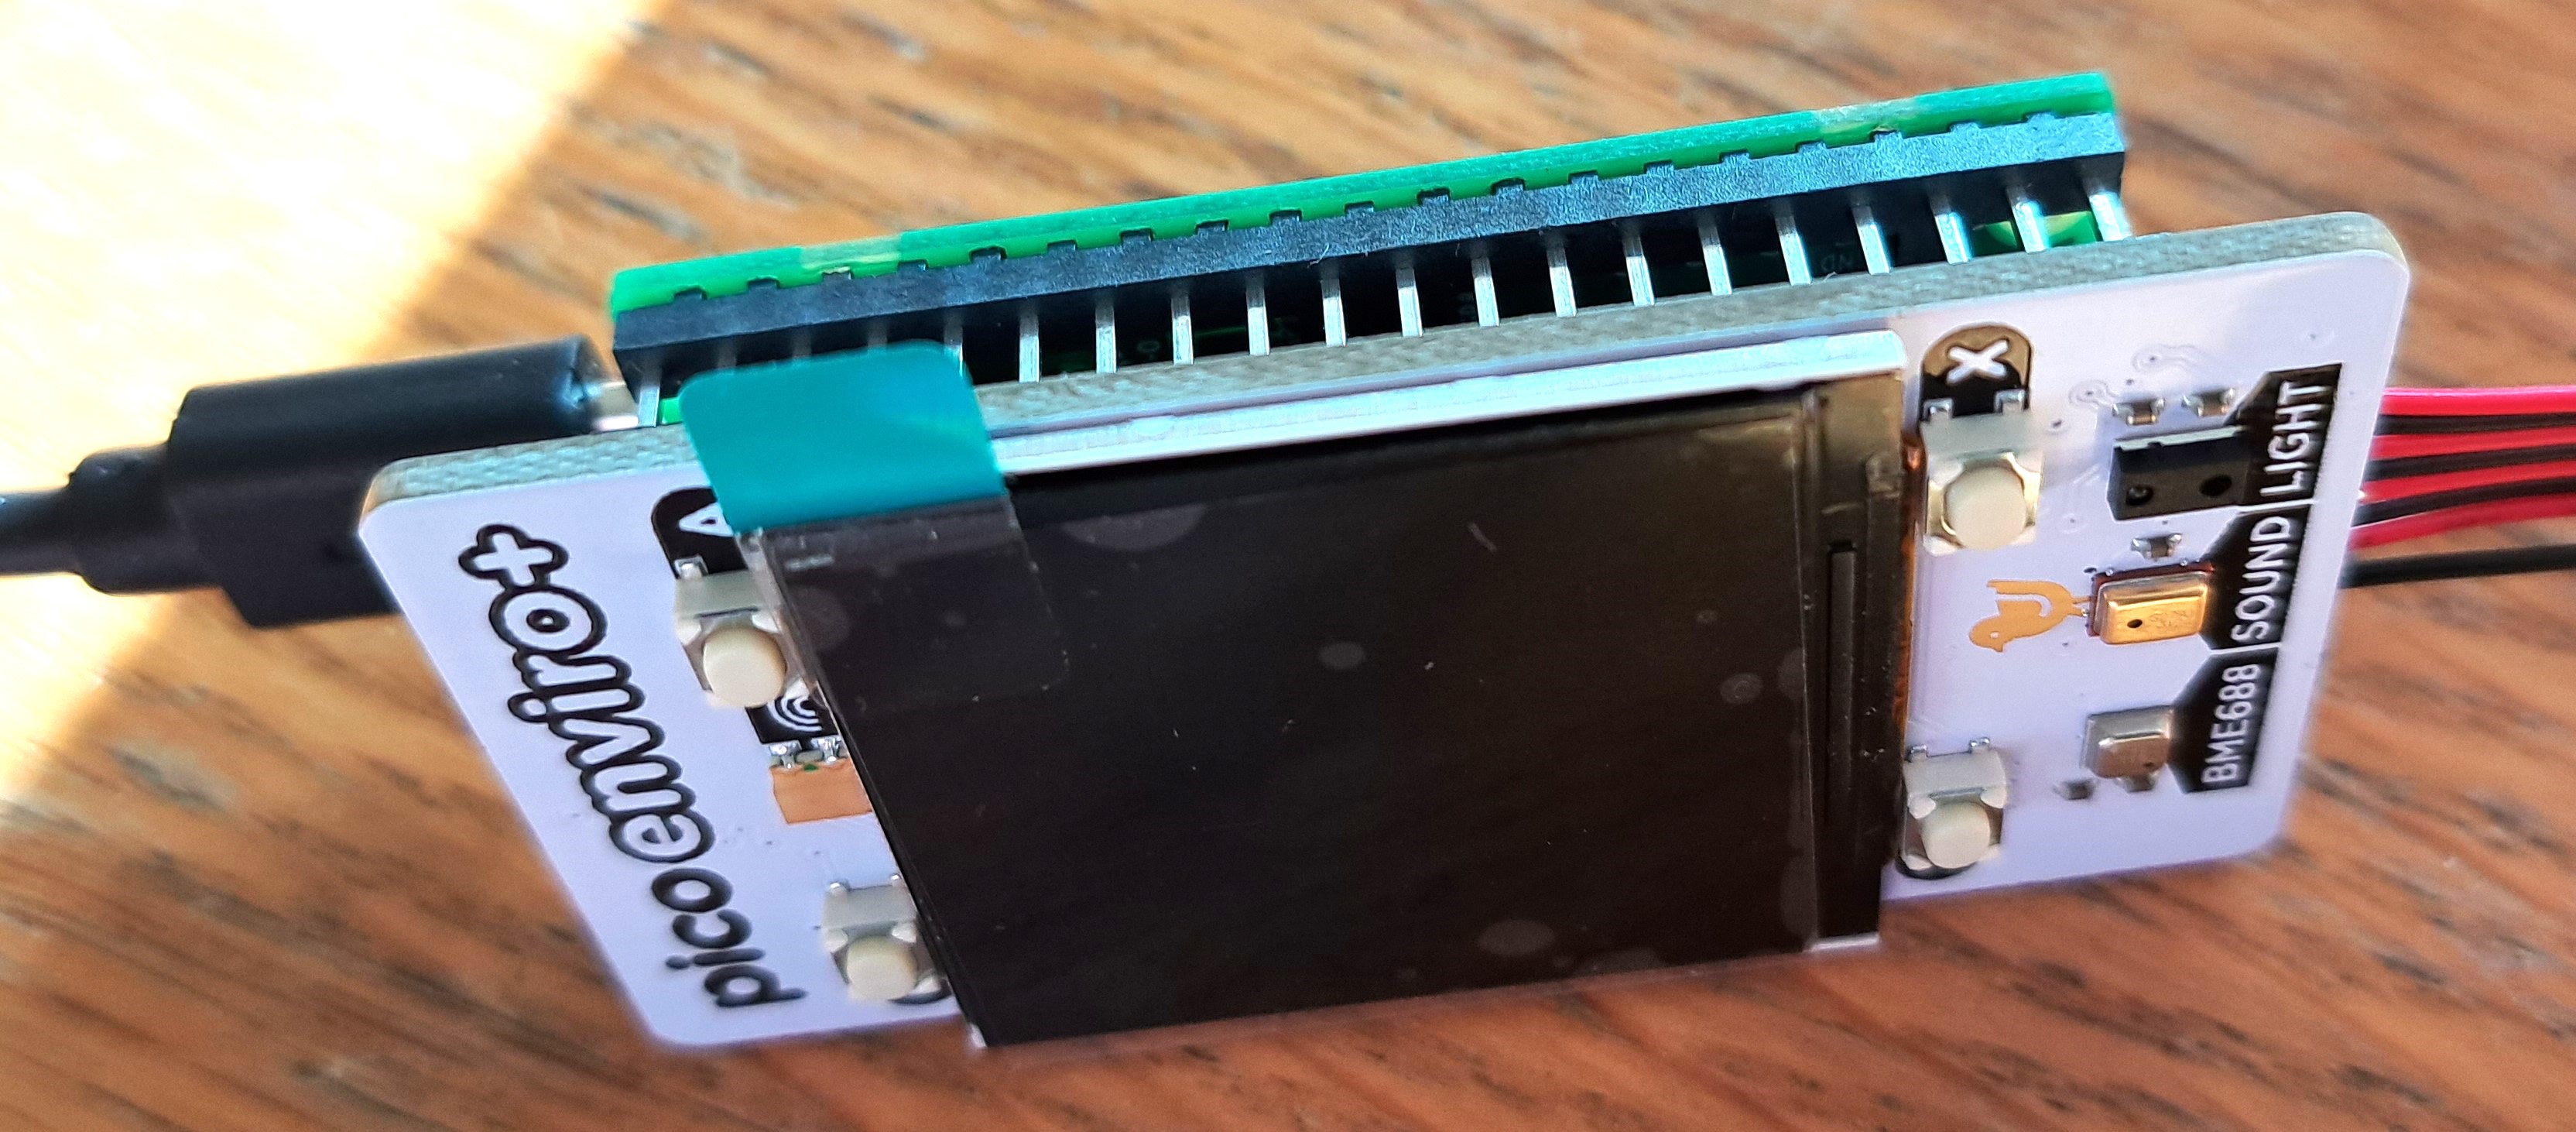
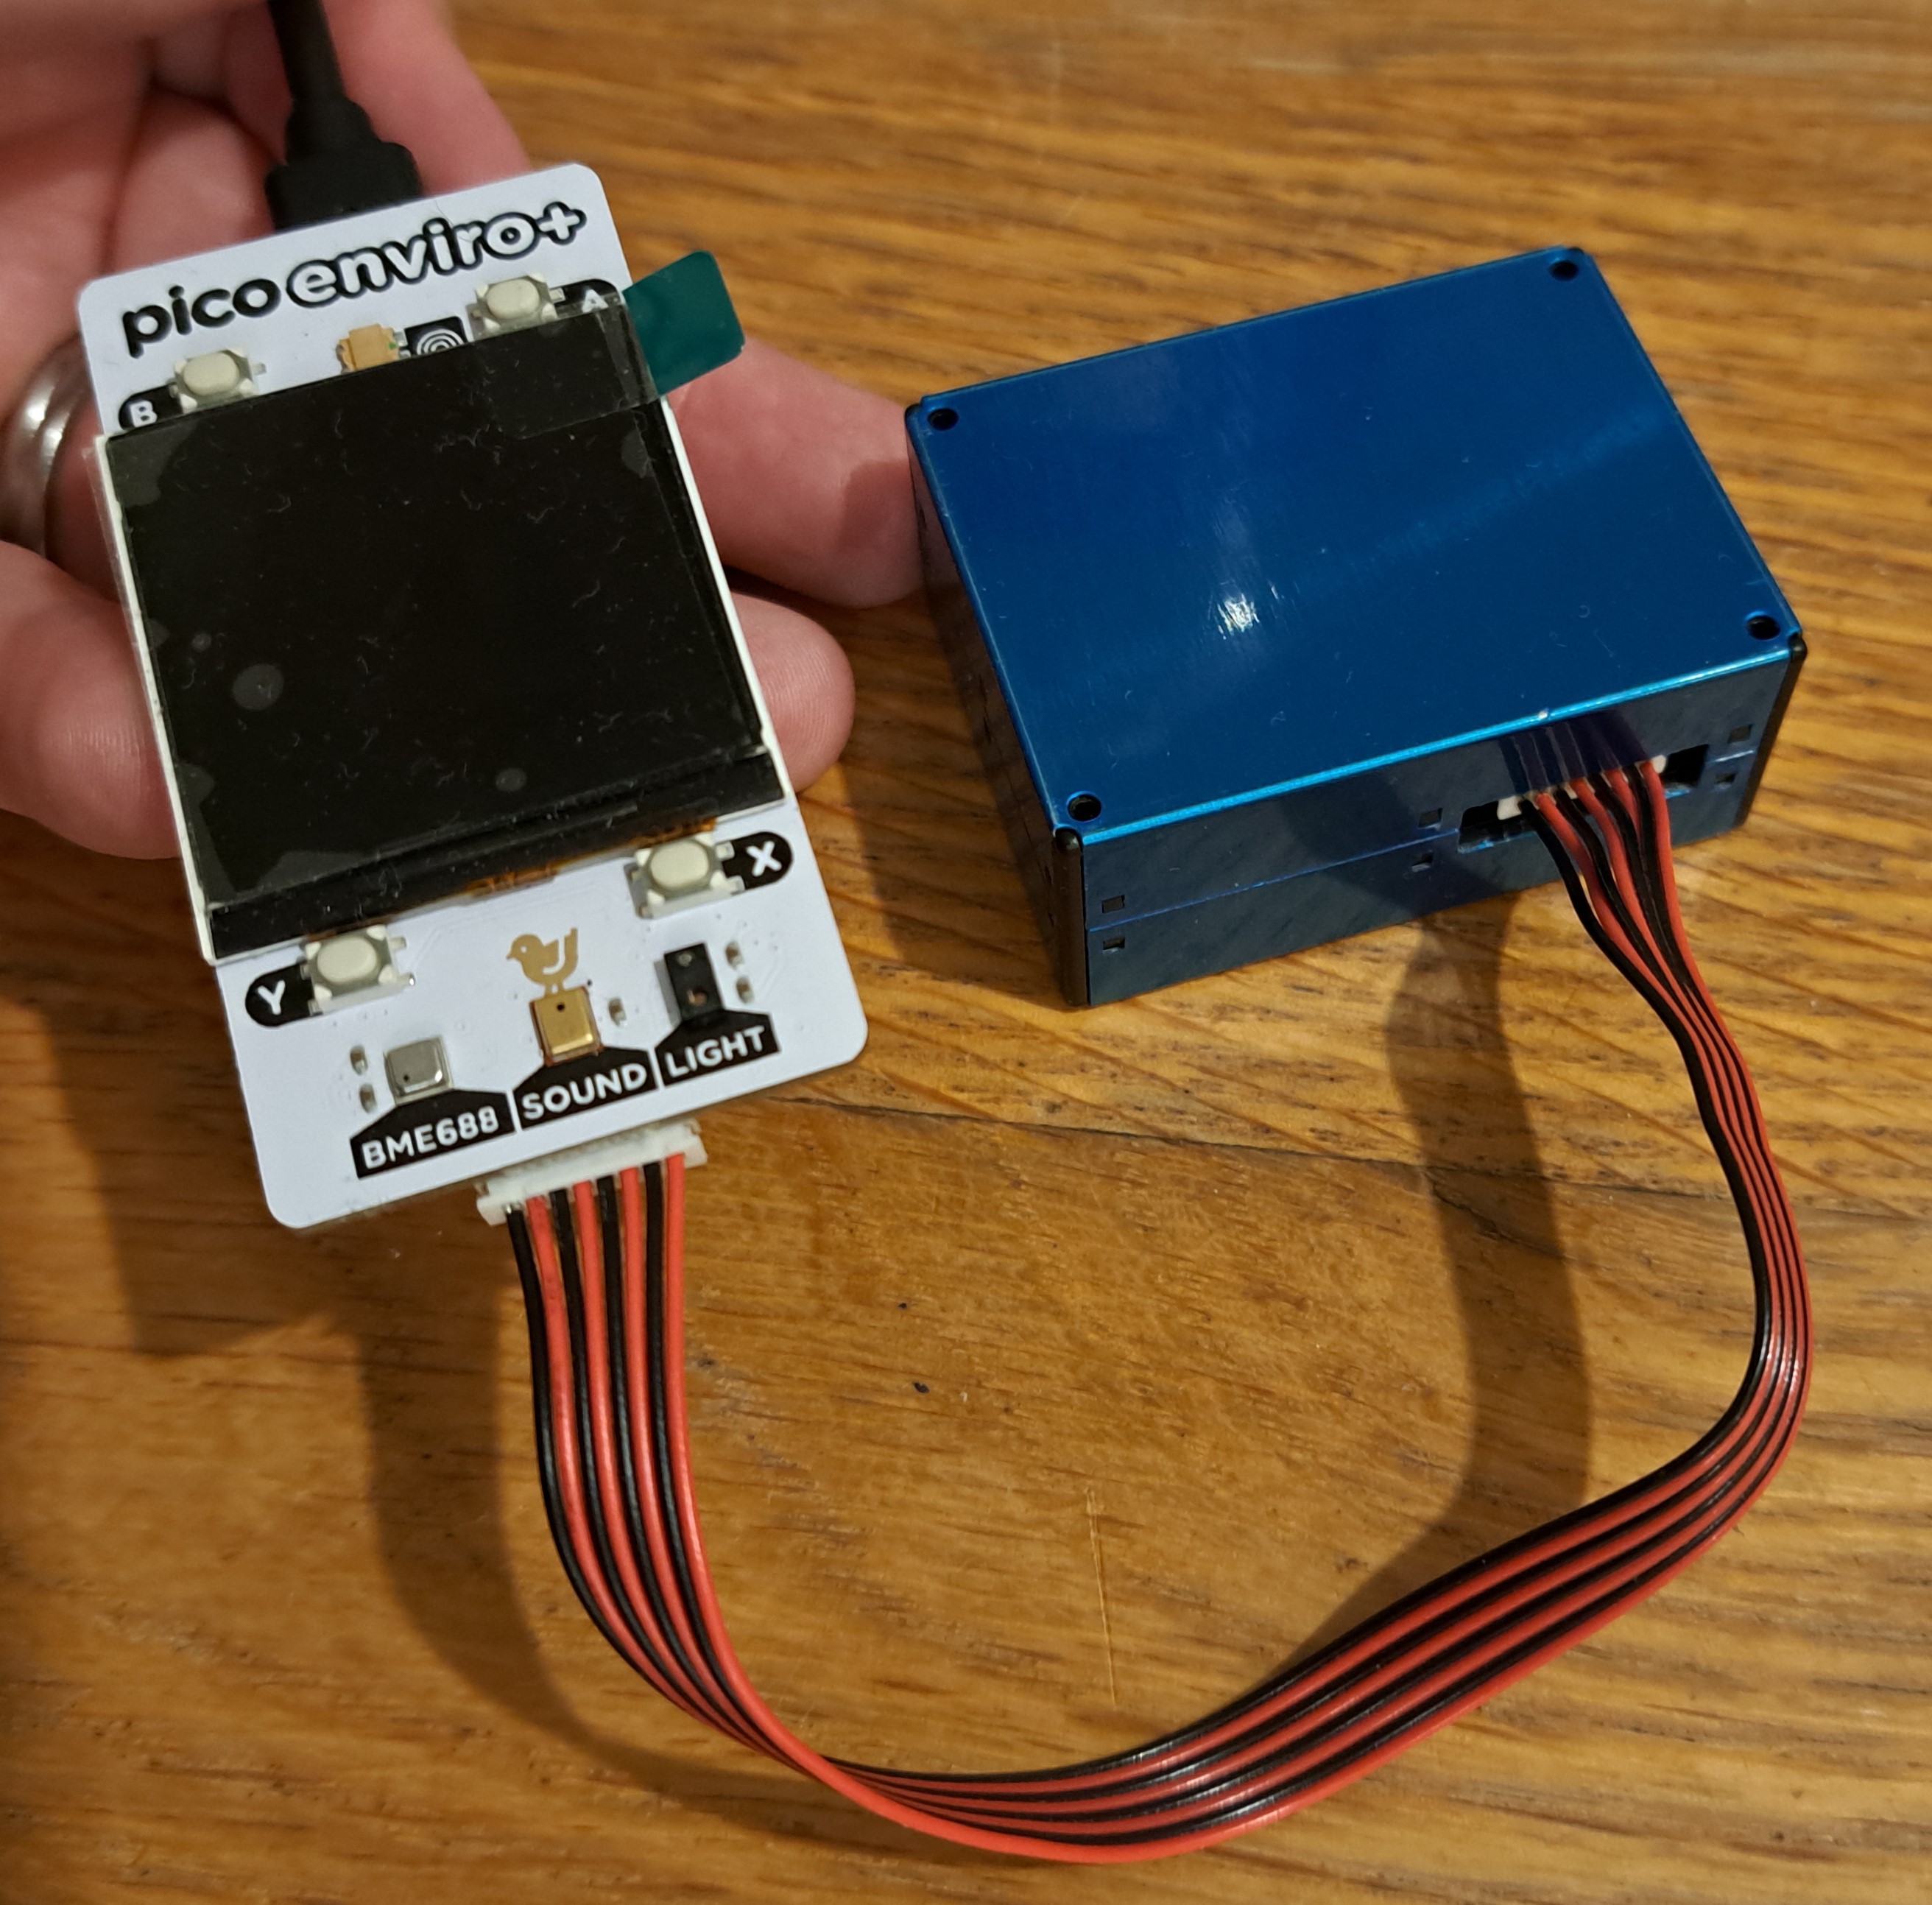
Next, connect the bottom of the PicoEnviro+ with the PMS5003 sensor using the red/black cable that comes with the PMS5003. The pins will only fit in the correct orientation (shown in the figures above). The furthest black wire should go towards the BME688 sensor on the PicoEnviro+. The furthest red wire should be nearest the edge (not middle) of the PMS5003 sensor.
Step 3: Upload Codes to Use Sensors
I like to check that individual sensors work / that I understand how individual sensors work before launching into the final code. If you prefer to skip to the final codes, skip the next section!Checking Sensors Work
Pimoroni's GitHub has multiple codes you can use to test whether your sensors are working as expected.
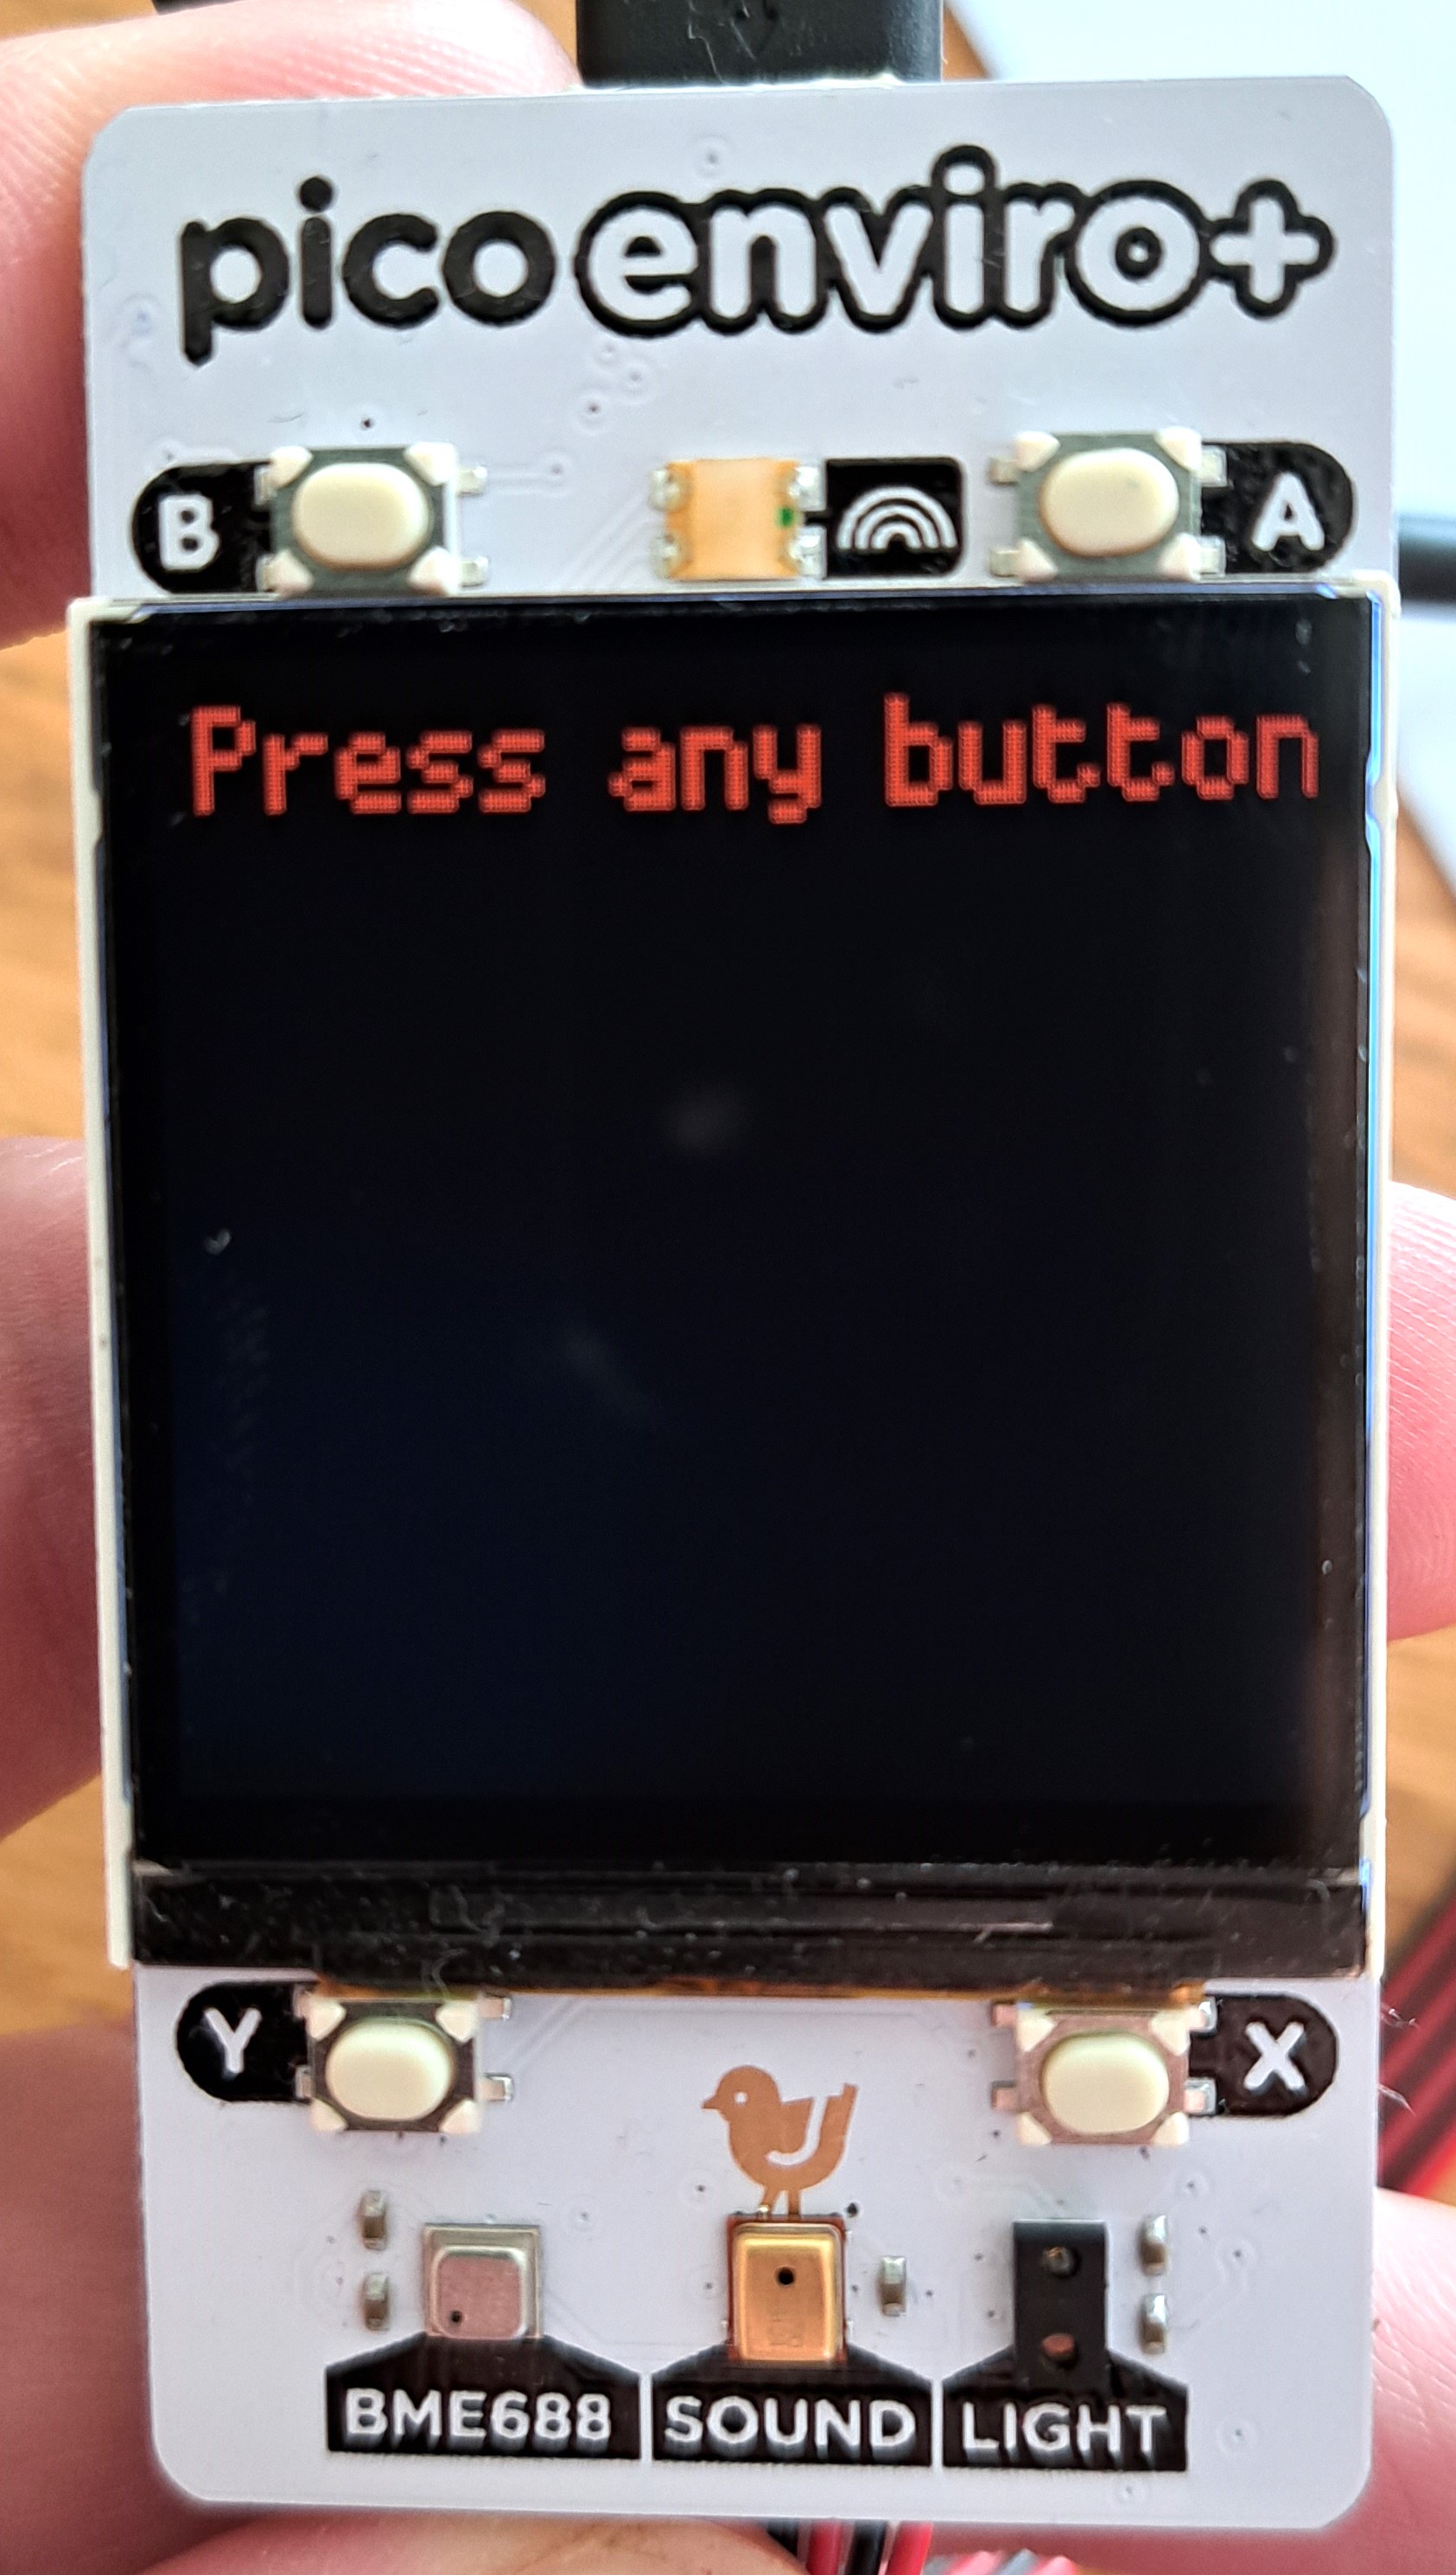
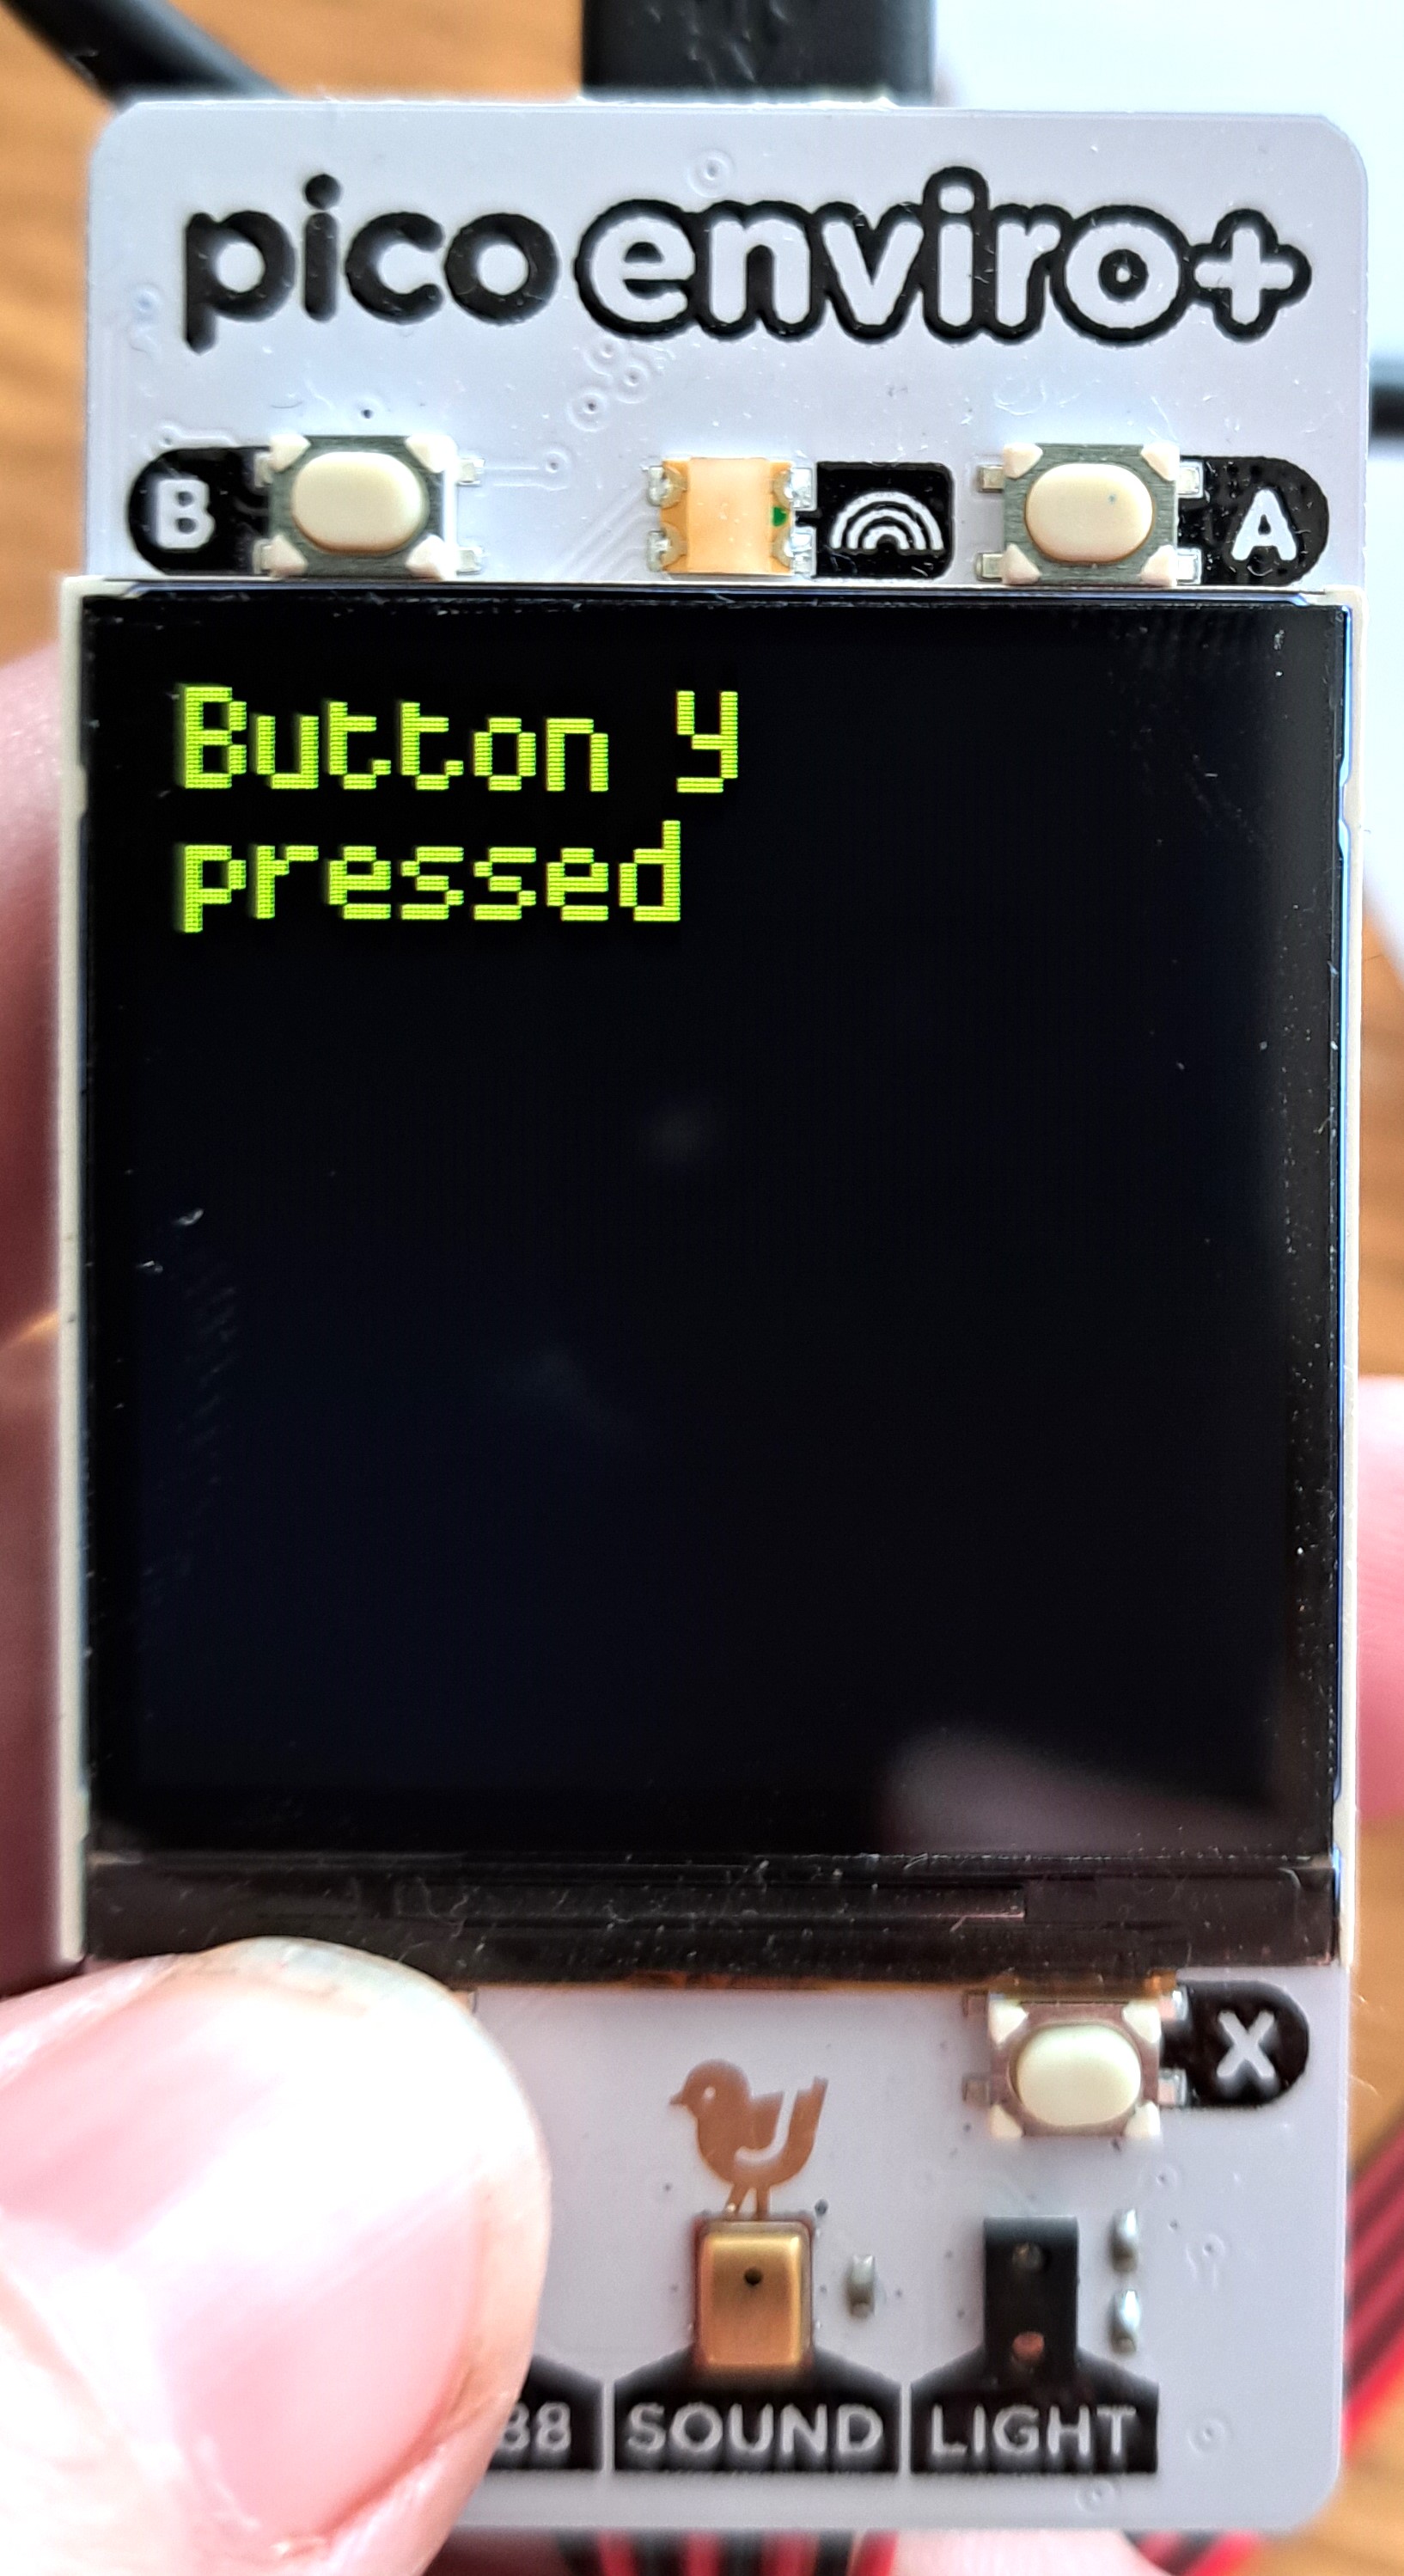
First, I ran "button_test.py" to check the PicoEnviro+ buttons were working. They all worked as expected - so I knew the Pico and PicoEnviro+ were talking to my computer.
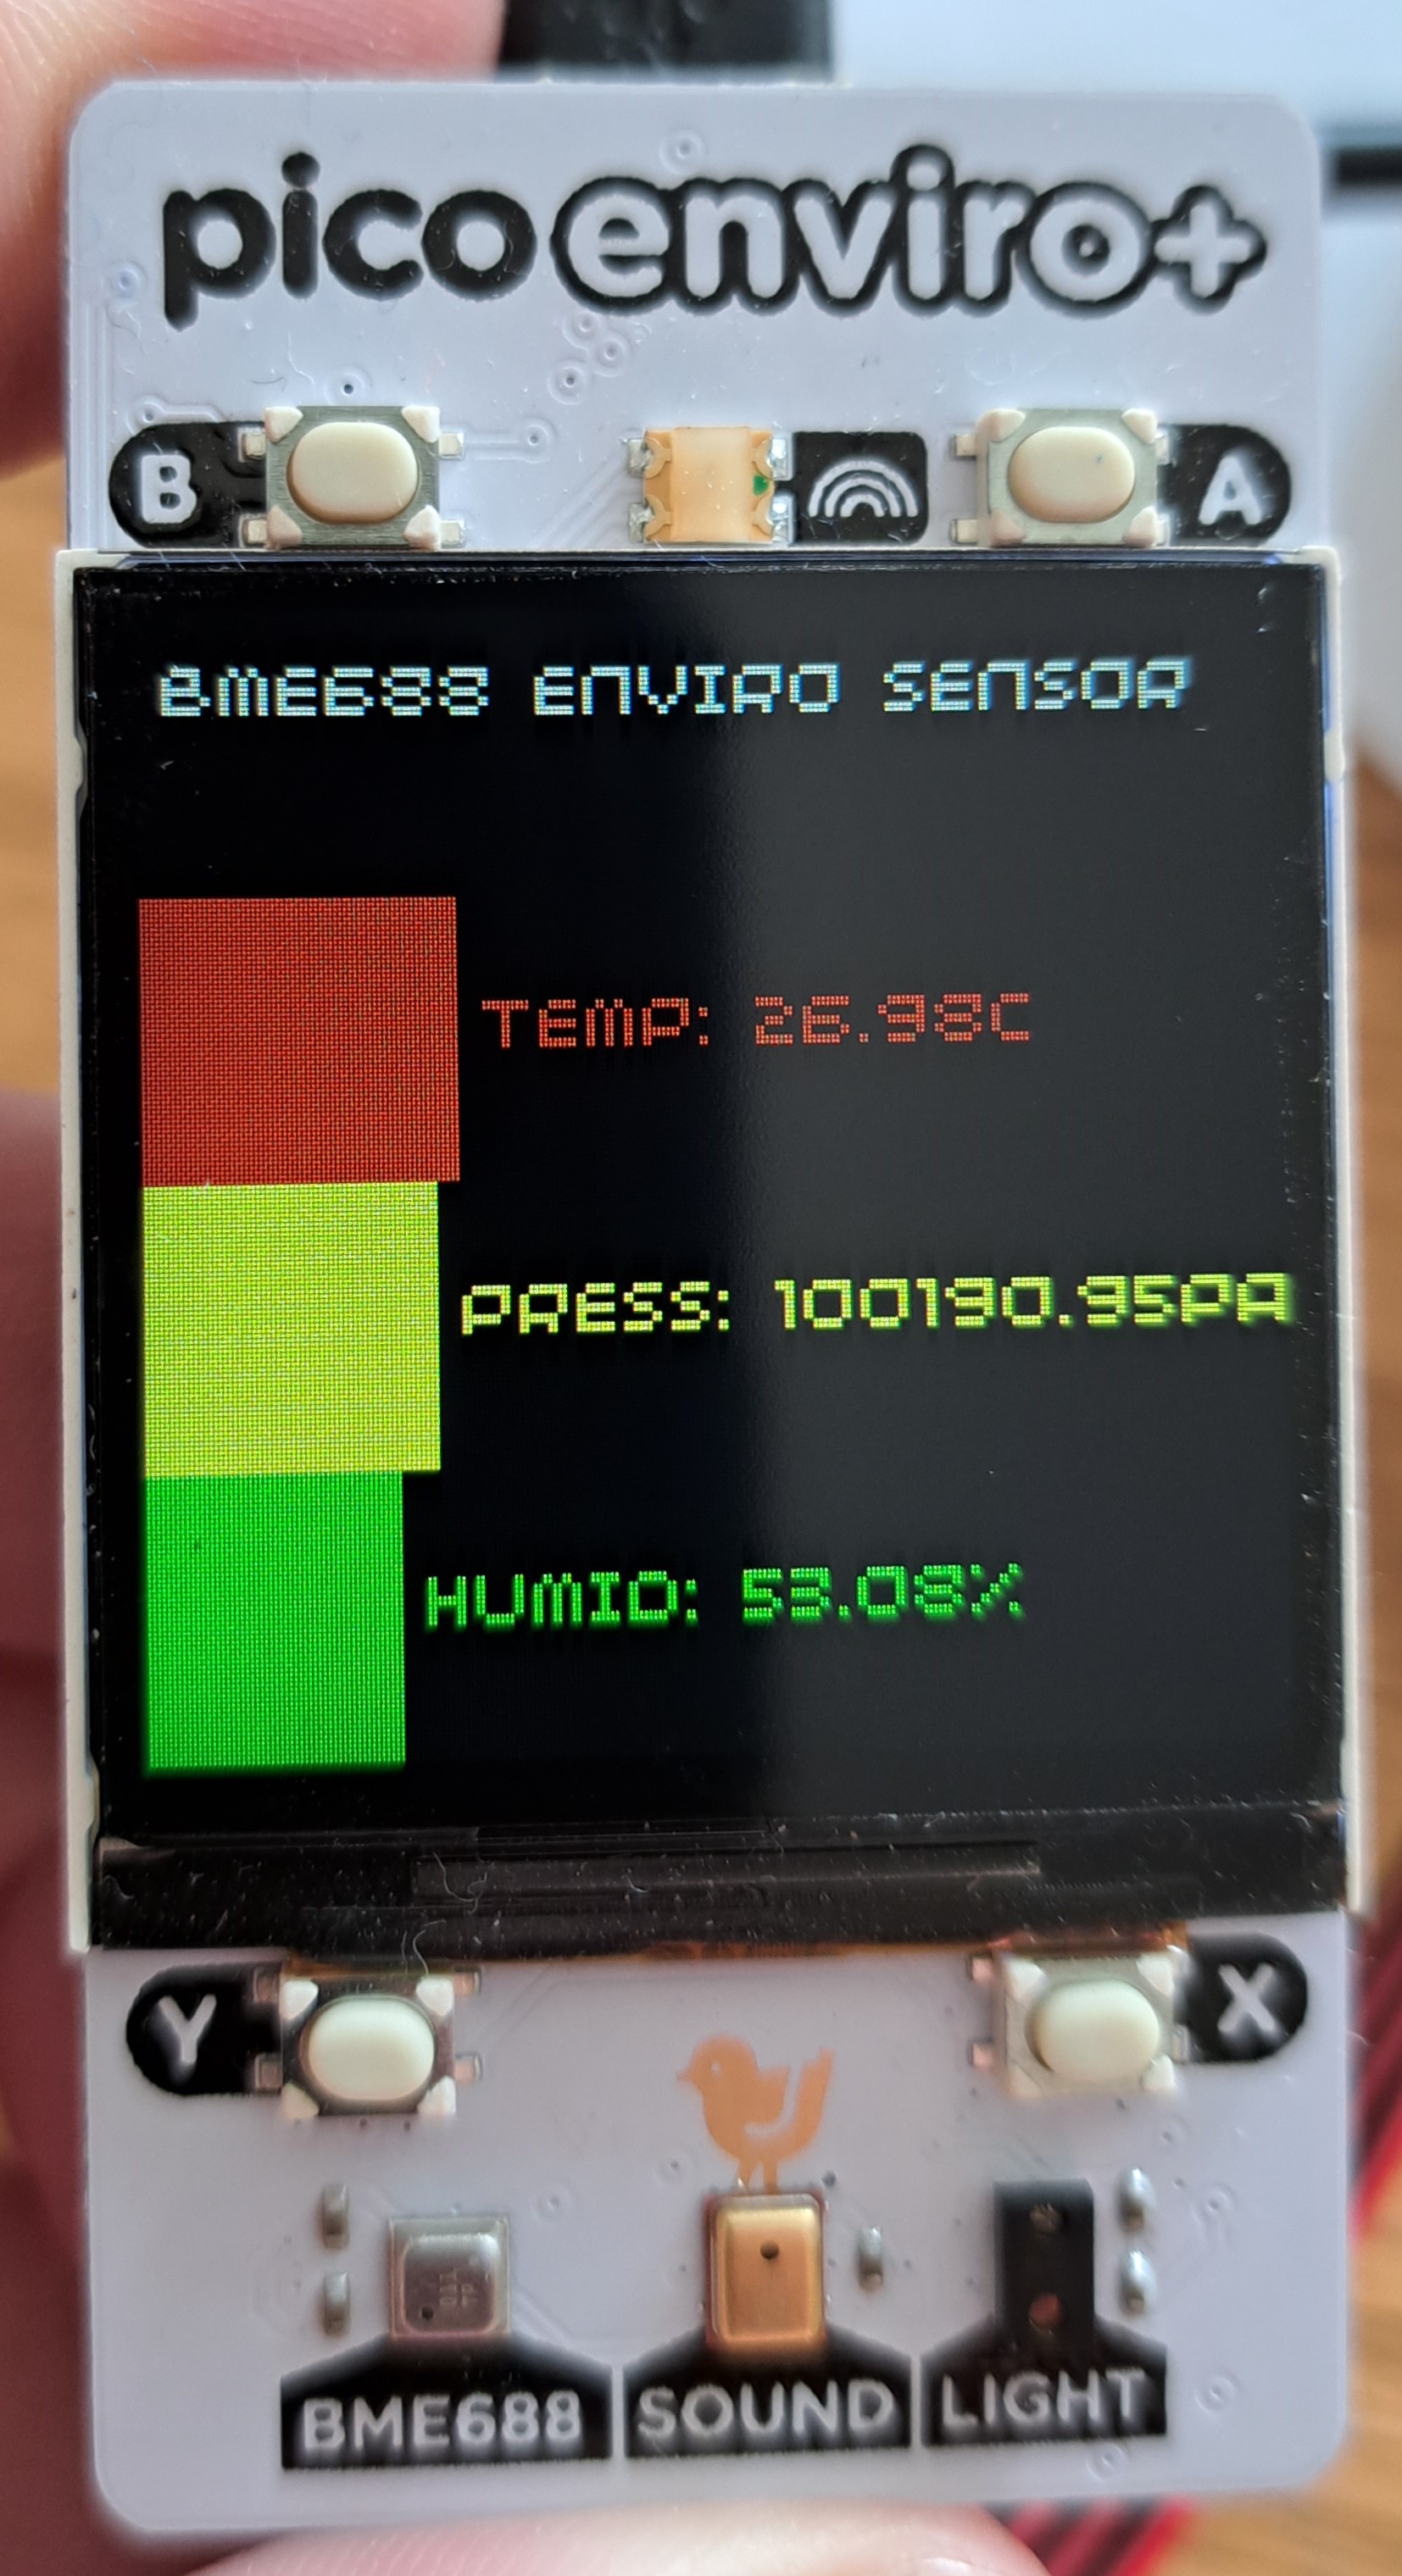
Next, I ran "bme688_sensor.py" to check the PicoEnviro+ sensors were working. Temperature, pressure, and humidity are displayed on the PicoEnviro+ screen. This data plus gas and heater data are also displayed on the computer screen. The temperature data seems wrong, however - it is definitely not 26C (or 26F!) in my room. The code scales the temperature ("scaled_temp = int(temp_value + 40) # Range from -40 to +60 = 1-100"), and this scaling may be incorrect!
Reading Sensor Data
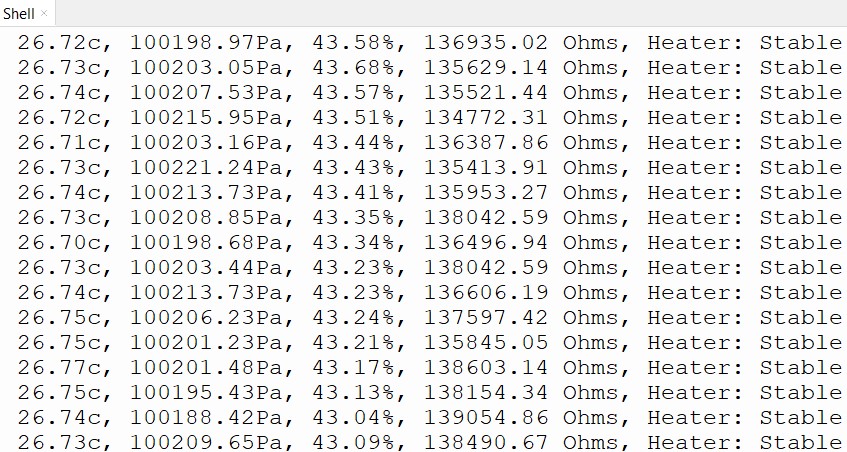
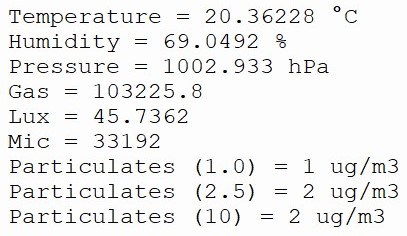
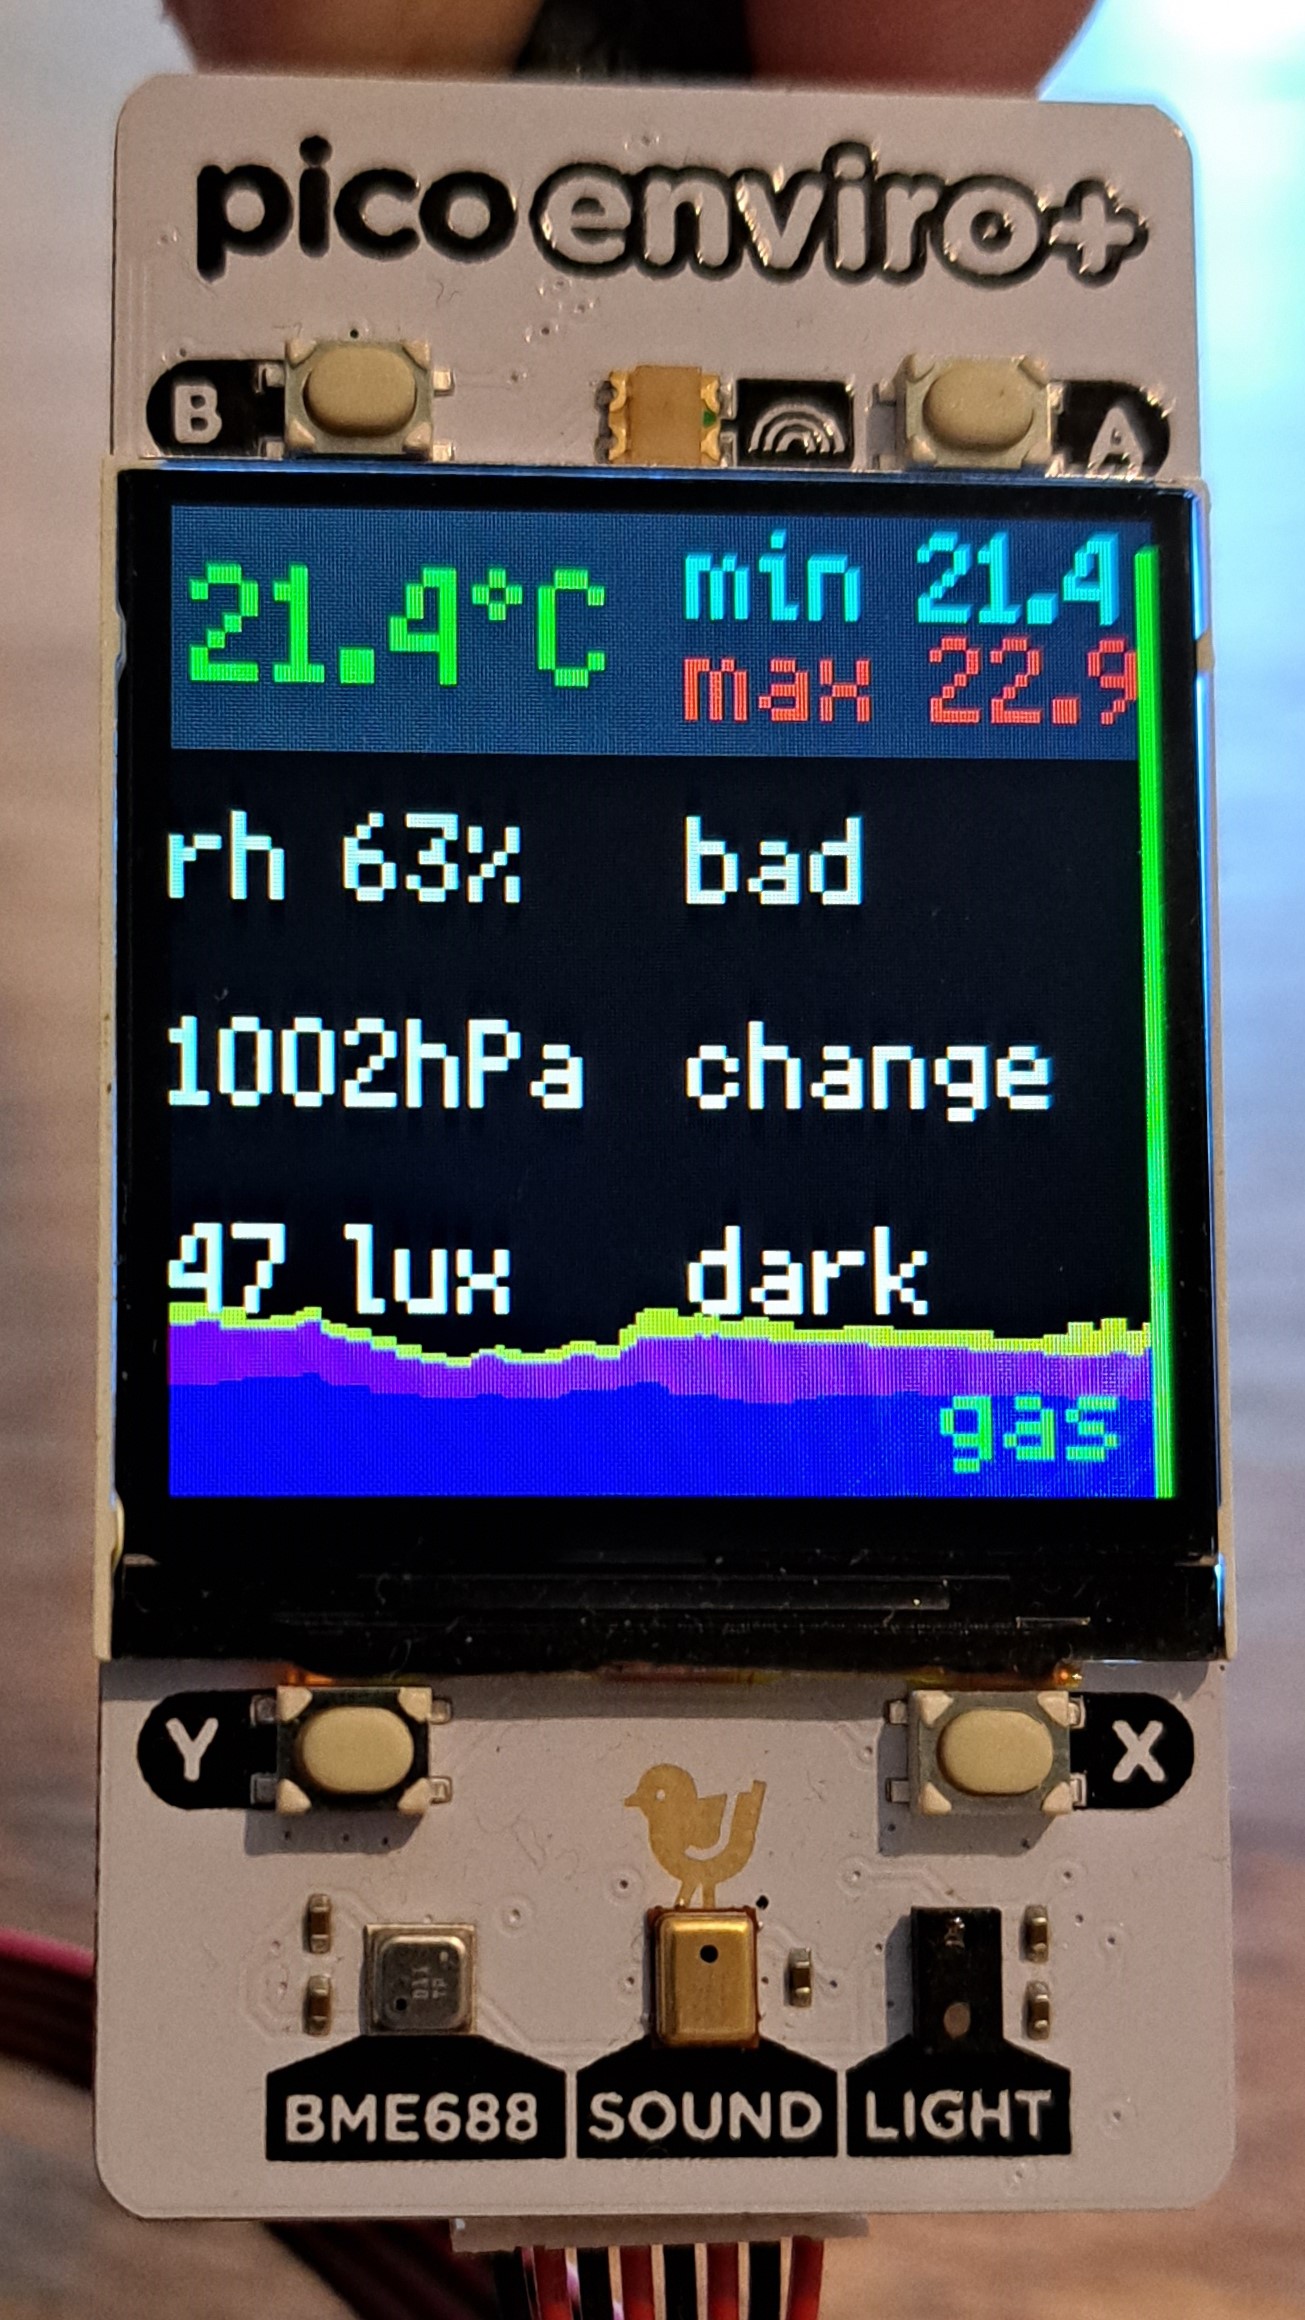
The GitHub page has 2 main codes (MIT License) to view the environmental data. The enviro_all_basic.py" code prints data to the computer screen (first/left figure below). The enviro_all.py" code prints data to the PicoEnviro+'s screen (second/right figure below). Both codes need the PMS5003-micropython (not PMS5003!) library installed (Tools-Manage Packages in Thonny). If you do not have a PMS5003 sensor, comment out (or delete) lines 7 and 34-40 in "enviro_all_basic.py" or lines 10 and 143-148 in "enviro_all.py".
I chose to use "enviro_all_basic.py" - which is shown below and available at the GitHub link above. I saved this as "main.py" onto the Pico (File - Save as - RaspberryPi Pico) so that the file runs whenever the Pico has power.
import time
from machine import Pin, ADC, UART
from pimoroni import RGBLED
from breakout_bme68x import BreakoutBME68X, STATUS_HEATER_STABLE
from pimoroni_i2c import PimoroniI2C
from breakout_ltr559 import BreakoutLTR559
from pms5003 import PMS5003

"""
This basic example shows how to read from all the sensors on Enviro+.
(plus the optional particulate sensor)
Prints results to the REPL.
"""

# change this to adjust temperature compensation
TEMPERATURE_OFFSET = 3

# set up the LED
led = RGBLED(6, 7, 10, invert=True)
led.set_rgb(255, 0, 0)

# set up the Pico's I2C
PINS_BREAKOUT_GARDEN = {"sda": 4, "scl": 5}
i2c = PimoroniI2C(**PINS_BREAKOUT_GARDEN)

# set up BME688 and LTR559 sensors
bme = BreakoutBME68X(i2c, address=0x77)
ltr = BreakoutLTR559(i2c)

# setup analog channel for microphone
MIC_PIN = 26
mic = ADC(Pin(26))

# configure the PMS5003 for Enviro+
pms5003 = PMS5003(
    uart=UART(1, tx=Pin(8), rx=Pin(9), baudrate=9600),
    pin_enable=Pin(3),
    pin_reset=Pin(2),
    mode="active"
)

while True:
    # read BME688
    temperature, pressure, humidity, gas, status, _, _ = bme.read()
    heater = "Stable" if status & STATUS_HEATER_STABLE else "Unstable"

    # correct temperature and humidity using an offset
    corrected_temperature = temperature - TEMPERATURE_OFFSET
    dewpoint = temperature - ((100 - humidity) / 5)
    corrected_humidity = 100 - (5 * (corrected_temperature - dewpoint))

    # read LTR559
    ltr_reading = ltr.get_reading()
    lux = ltr_reading[BreakoutLTR559.LUX]
    prox = ltr_reading[BreakoutLTR559.PROXIMITY]

    # read mic
    mic_reading = mic.read_u16()

    # read particle sensor
    particulate_reading = pms5003.read()

    if heater == "Stable" and ltr_reading is not None:
        led.set_rgb(0, 0, 0)
        print(f"""
             Temperature = {corrected_temperature} °C
             Humidity = {corrected_humidity} %
             Pressure = {pressure/100} hPa
             Gas = {gas}
             Lux = {lux}
             Mic = {mic_reading}
             Particulates (1.0) = {particulate_reading.pm_ug_per_m3(1.0)} ug/m3
             Particulates (2.5) = {particulate_reading.pm_ug_per_m3(2.5)} ug/m3
             Particulates (10) = {particulate_reading.pm_ug_per_m3(10)} ug/m3
             """)
    else:
        # light up the LED red if there's a problem with the BME688 or LTR559 sensor readings
        led.set_rgb(255, 0, 0)

    time.sleep(1.0)
Saving Sensor Data
I used "main.py" / "enviro_all_basic.py" to have the PicoEnviro+ read real-time environmental data. This code does not save the data anywhere. The data can be saved to the Pico, but the Pico would quickly run out of space and my goal is to see if/how this environmental data changes over time. Therefore, I used a second file (called "LocalSave.py", written by Dr Hugo Martay) to read the environmental data and save the data to a csv file located on my computer. The code is shown below.
  import serial
  import datetime

  ser = serial.Serial("COM5",9600)  # open first serial port
  print(ser.portstr)       # check which port was really used
  start = datetime.datetime.now()
  filename_all = f"C:/tmp/pico_output_all.csv"
  for i in range(1000000):
      s = ser.readline()      # write a string
      print(f"read:{s}")
      if len(s)>10:
          b = str(s).replace("b'","").replace("\\r\\n'",'')
          b = f"{datetime.datetime.now()}, {b}"
          print(b+"\n")
          with open(filename_all,"a") as file:
              file.write(f"{b}\n")

  ser.close()
Step 4: Produce Graphs to Analyze Data
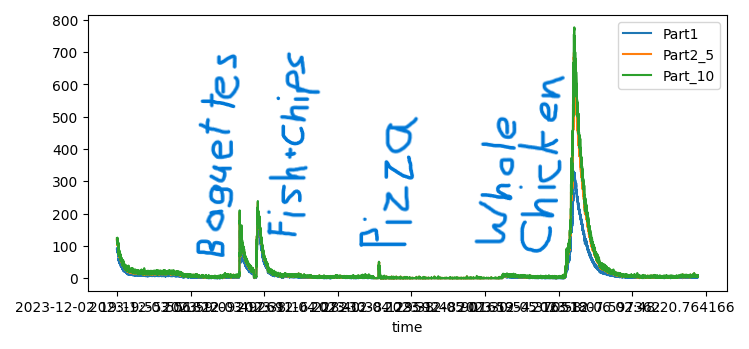
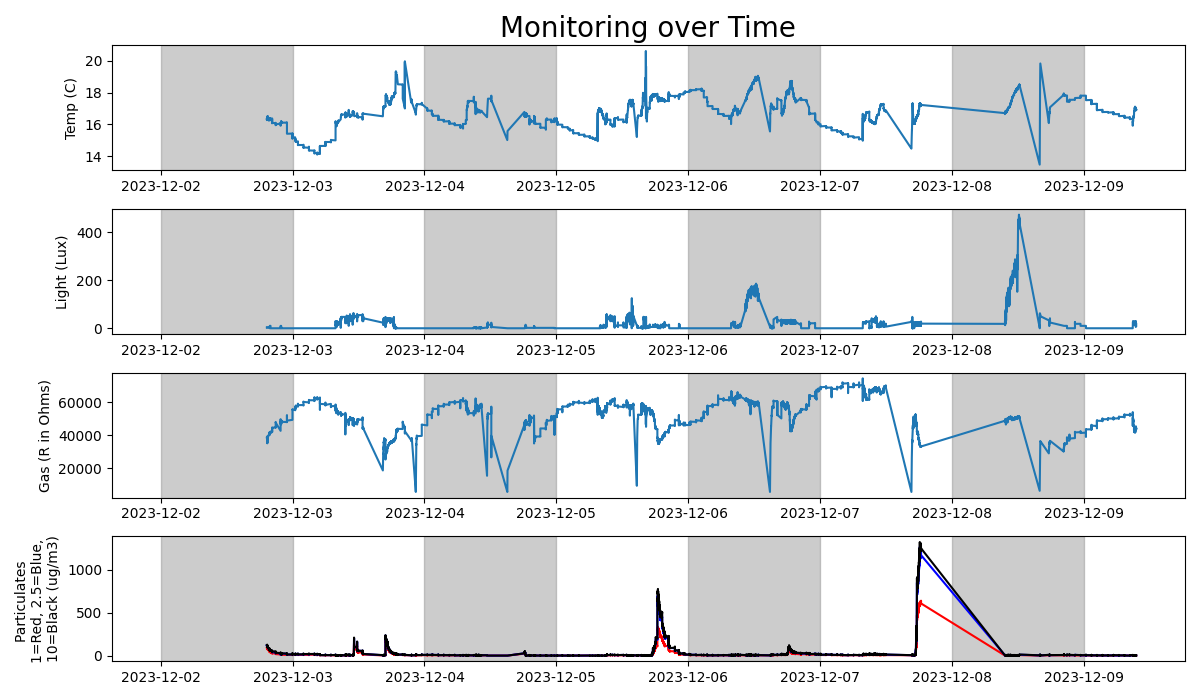
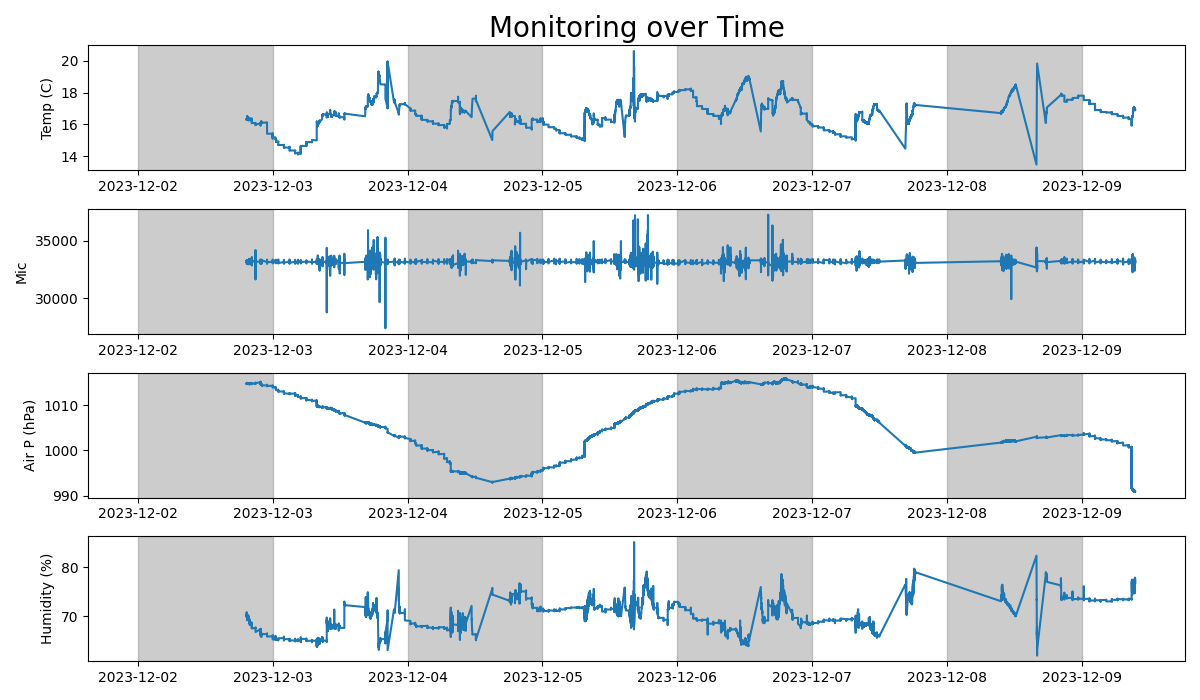
Finally, I plotted the environmental data against time using the below file (also written alongside Dr Hugo Martay). Plotting all of the data in a single figure meant the data was too small to easily see. Therefore, I made 2 figures, each with 4 subplots. Temperature is shown at the top of each figure. Alternating days are shaded in gray to allow easier comparisons between days.The first week's environmental data and the relevant code are shown below.
Note, there are some inaccuracies and potentially confusing aspects in the data.
1. I accidentally left the PicoEnviro+ upside down on Dec 4th, so the Light values for that day are inaccurate.
2. There are some time intervals when data was not being recorded, for example overnight from Dec 7th to 8th. The last data point of Dec 7th and the first data point of Dec 8th are connected with a straight line. The "data" along this straight line are therefore interpolations rather than recorded data. Perhaps it would be better to not show this interpolated data to avoid confusion with recorded data.
On the other hand, some data which appear incorrect are actually correct.
1. The temperature data seems to be too low (down to 14° at night). I have verified the temperature values against the room's thermostat and against a temperature and humidity sensor from an Arduino kit - and all the sensors agree. The reason the temperature dips so far at night is because our thermostat is going into "Eco mode" at night. Our house really is this cold!
2. The spikes in Particulates values also seem strange. These spikes occur whenever we use our oven, with higher spikes corresponding to longer cooking times. The spikes are at least partially explained by a seal in our oven being loose, allowing particulates to exit the oven while in use.
3. The humidity levels in our house are unusually (and potentially unhealthily!) high. We have 3 small children with a lot of laundry but no dryer. Therefore, we have a lot of wet laundry air-drying in our house. It looks like it would be worth us investing in a dehumidifier!
In summary, even after just a week's use, I have identified various different ways to improve the environment within our home!
  import pandas as pd
  import matplotlib.pyplot as plt
  import datetime

  def greys():
      for day_start, day_end in days:
          for a in ax:
              a.axvspan(day_start, day_end, color='grey', alpha=0.4)

  plt.rcParams["figure.figsize"] = [7.50, 3.50]
  plt.rcParams["figure.autolayout"] = True

  headers = ['time','Temp', 'Humid', 'Air P', 'Gas', 'Lux', 'Mic','Part1', 'Part2_5', 'Part10']

  df = pd.read_csv('C:/tmp/pico_output_all.csv', names=headers)
  df['time'] = pd.to_datetime(df['time'])
  days_start = df['time'].iloc[0].date()
  days_end = df['time'].iloc[-1].date()
  days = pd.date_range(start=days_start, end=days_end+datetime.timedelta(days=1))
  days = zip(days[::2],days[1::2])

  df.set_index('time', inplace=True)

  #First Figure
  fig, ax = plt.subplots(4, 1, figsize=(12,7), num=1)
  ax[0].set_title("Monitoring over Time", fontsize=20)
  #plot 1
  ax[0].set_ylabel('Temp (C)')
  ax[0].plot(df['Temp'])

  #plot 2
  ax[1].set_ylabel('Light (Lux)')
  ax[1].plot(df['Lux'])

  #plot 3
  ax[2].set_ylabel('Gas (R in Ohms)')
  ax[2].plot(df['Gas'])

  #plot 4
  ax[3].set_ylabel('Particulates \n1=Red, 2.5=Blue, \n10=Black (ug/m3)')
  ax[3].plot(df['Part1'], '-r')
  ax[3].plot(df['Part2_5'], '-b')
  ax[3].plot(df['Part10'], '-k')

  greys()
  plt.show()

  #Second Figure
  fig, ax = plt.subplots(4, 1, figsize=(12,7), num=2)
  ax[0].set_title("Monitoring over Time", fontsize=20)
  #plot 1
  ax[0].set_ylabel('Temp (C)')
  ax[0].plot(df['Temp'])

  #plot 2
  ax[1].set_ylabel('Mic')
  ax[1].plot(df['Mic'])

  #plot 3
  ax[2].set_ylabel('Air P (hPa)')
  ax[2].plot(df['Air P'])

  #plot 4
  ax[3].set_ylabel('Humidity (%)')
  ax[3].plot(df['Humid'])

  greys()
  plt.show()
A Final Overview!
Things I really liked:-Very easy to set-up and use.
-Cheap environmental monitoring system.
-Using system to improve our home and health is wonderful!
Things I suggest improving:
-Having a single website that goes through all steps of project and contains all required codes (hence purpose of this page!).
-Using an external power source or RaspberryPi (not Pico) rather than needing to keep sensors plugged into laptop all the time.
-Temperature sensor has an offset built into the code and it's not clear how this offset value was determined.
This environmental monitoring kit is amazing! It is a cheap, quick, and easy way to get a better understanding of the health of your house - and potentially, by extension, to your family members (especially if anyone has asthma, etc). I will definitely continue using the monitoring system, potentially with a RaspberryPi instead so I can leave the sensor in one place with its own battery rather than needing to have the sensors plugged into my computer.
Other Articles:
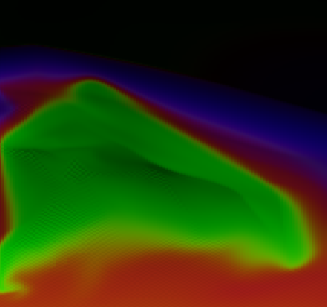
AtmosphereA simple demo of a simulation of an atmosphere. It looks quite cool, but there's not a lot you can do with it yet, and the physics isn't yet all that accurate. |
|
|
Mars LanderAn interactive simulation of a Mars Lander trying to land on Mars. The term "interactive" here means that you have to write the software, in Javascript, that will land the probe. |
© Hugo2015. Session @sessionNumber